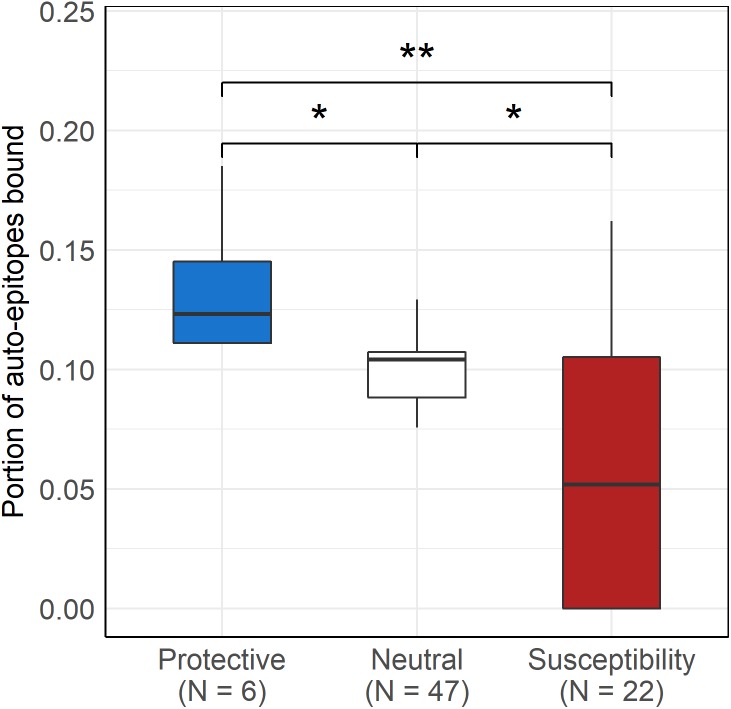
Figure 4. Protective DQ alleles bind more, while risk DQ alleles bind less autoimmune disease-associated epitopes than neutral ones.
Boxplot indicates median (horizontal line), the first and third quartile (bottom and top of boxes) and minimum and maximum values (vertical lines). The bound portion of auto-epitopes of the given disease that is associated with the given allele is shown for protective and susceptibility groups. The portion of all auto-epitopes bound by each allele is shown for the neutral allele group. * Pcorr < 0.005 (pairwise Wilcoxon test), ** Pcorr < 0.01 (pairwise Wilcoxon test)

