
Fig. 2. Generation and characterization of AnxA1-rich MVs from healthy neutrophils.
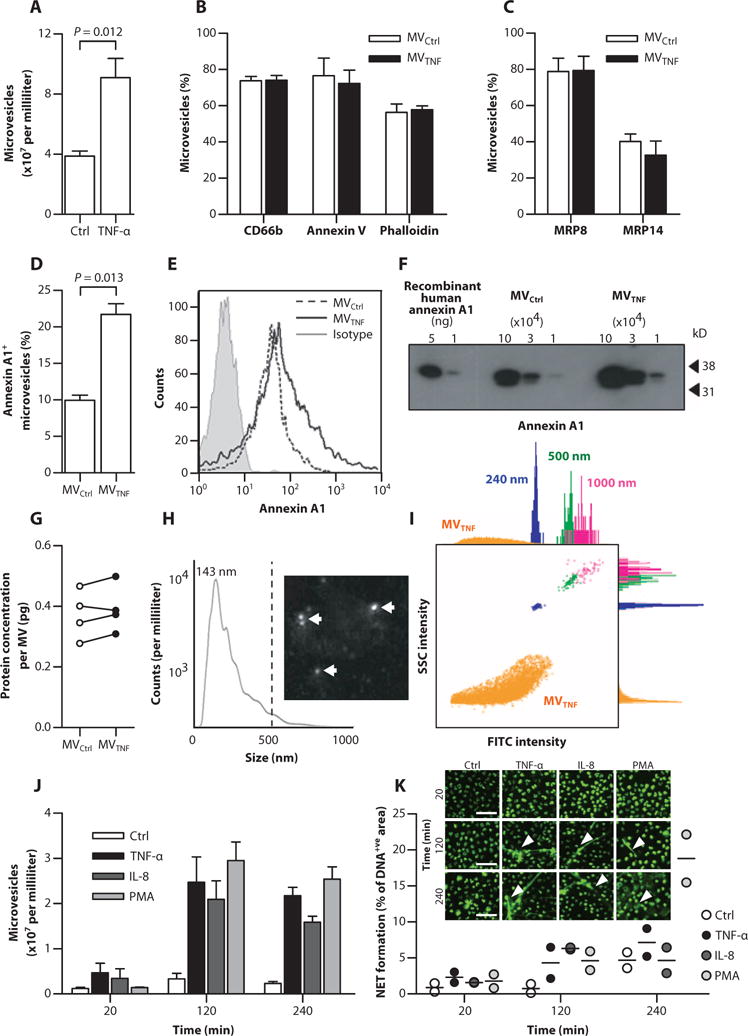
(A) Human circulating neutrophils (106) were stimulated with TNF-α (50 ng/ml) or vehicle (Control); resultant MVTNF or MVCtrl, respective ly, was enumerated. (B) Expression of CD66b, annexin V, and phalloidin. (C) Expression of MRP8 and MRP14. (D and E) The percentage of AnxA1+ MVs (D) and comparative surface expression (E) of AnxA1. Data in (A) to (E) are means ± SEM (n = 4). P values were determined by two-tailed Student’s t test. (F) AnxA1 content in MVTNF by Western blotting. Human recombinant AnxA1 was the positive control. (G) Total protein concentration of paired MVCtrl and MVTNF (n = 4 donors). (H) NTA for absolute MV size (six pooled MVTNF donors). Dotted line indicates 90% of MVs below 412 nm; median was 143 nm. The representative image is a still from the NTA. White arrows indicate MVs. (I) Representative side scatter (SSC)/fluorescence plot from ImageStreamX showing MVs (orange) versus 240- (blue), 500- (green), and 1000-nm (pink) calibration beads, with related histograms. FITC, fluorescein isothiocyanate. (J) MVs quantified at 20 min, 2 hours, and 4 hours after stimulation of parent human neutrophils with TNF-α (50 ng/ml), IL-8 (50 ng/ml), or PMA (100 nM). Data are means ± SEM (n = 3). (K) NET formation (n = 2). Images are representative micrographs used for analysis; white arrowheads indicate NETs. Scale bars, 50 μm.