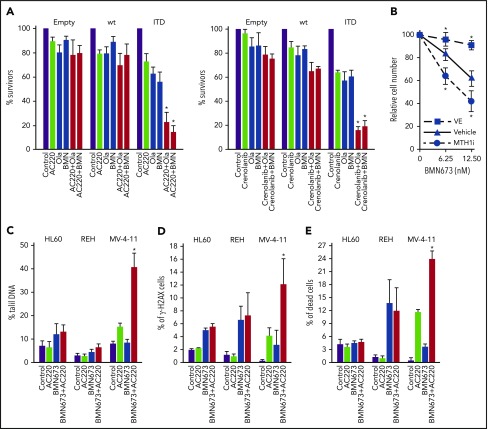
Figure 3.
FLT3i’s enhanced the antileukemia effect of PARP1i’s in FLT3(ITD)-positive cell lines. (A) BaF3 parental cells transfected with empty plasmid (Empty) and those expressing FLT3(wt) or FLT3(ITD) mutant (ITD) were left untreated (Control) or were incubated with PARP1i [1.25 μM olaparib (Ola), 12.5 nM BMN673 (BMN)], FLT3i (10 nM AC220, 10 nM crenolanib), and FLT3i+PARP1i for 96 hours in the presence of IL-3. Results from 3 experiments are represented by the mean (percentage) ± SD of living cells detected by trypan blue exclusion compared with untreated counterparts. *P < .001 vs individual treatment, 2-tailed Student t test. (B) FLT3(ITD)-positive BaF3 cells were incubated with the indicated concentrations of BMN673, alone or in combination with 200 μM vitamin E (VE) or 3 μM MTH1i SCH51344, for 96 hours in the presence of IL-3. Results represent mean (percentage) ± SD of living cells detected by trypan blue exclusion in comparison with untreated control from 3 independent experiments. *P < .05 vs BMN673 treatment, 2-tailed Student t test. (C-E) MV-4-11 [FLT3(ITD)-positive] and HL60 and REH [both FLT3(ITD)-negative] human leukemia cell lines were left untreated (Control) or were treated with 5 nM BMN673, 10 nM AC220, or the combination. DSBs were detected after 24 hours by neutral comet assay (C) and γ-H2AX immunofluorescence (D). (E) Dead cells were determined by fixable dead cell stain after 96 hours. Results represent mean ± SD from 3 experiments. *P < .02 vs individual treatment, 2-tailed Student t test (C-E).

