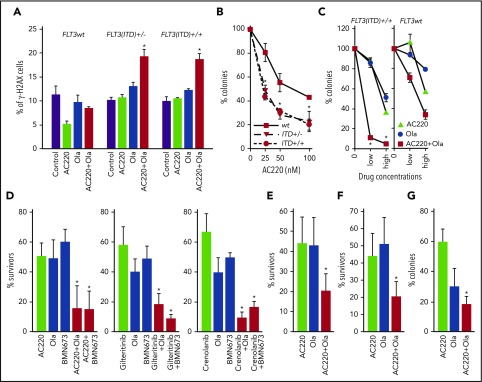
Figure 4.
FLT3i enhanced the antileukemia effect of PARP1i’s against proliferating and quiescent primary FLT3(ITD)-positive cells. (A-B) LSK bone marrow cells from FLT3(ITD)+/+, FLT3(ITD)+/−, and FLT3(wt) mice (n = 3 per group) were incubated for 24 hours with 100 nM AC220 and/or 2.5 μM olaparib (Ola), followed by γ-H2AX immunostaining, and for 4 days with 2.5 μM Ola and the indicated concentrations of AC220, followed by plating in methylcellulose. Results represent mean (percentage) ± SD of γ-H2AX positive cells (A) and surviving clonogenic cells (B) compared with their Ola-treated counterparts. *P < .05, 2-tailed Student t test. (C) GFP+ FLT3(ITD)-positive LSK murine bone marrow cells [FLT3(ITD)+/+] and GFP+ LSK normal counterparts [FLT3(wt)] obtained from 2 or 3 mice per group were left untreated (0) or were treated with AC220 (low: 20 nM; high: 100 nM), Ola (low: 1 μM; high: 2.5 μM), and the combination of AC220 + Ola in the presence of growth factors for 4 days, followed by plating in methylcellulose. Results represent mean (percentage) ± SD of colonies in comparison with untreated group from triplicate experiments. *P < .001 vs individual treatments using response additivity approach. Lin−CD34+ FLT3(ITD)-positive cells from 5 AML patients (188, 194, 499, 9KM3949, 10KM1950) were stained with CTV and left untreated or were treated with the FLT3i’s AC220 (10 nM), crenolanib (10 nM), and gliteritinib (10 nM), the PARP1i’s Ola (2.5 μM) and BMN673 (25 nM), and the combination of FLT3i + PARP1i in the presence of growth factors for 3 days, followed by assessment of Lin−CD34+ clonogenic cells (D) and immunofluorescent detection of Lin−CD34+CD38−CTVlow cells (E) and Lin−CD34+CD38−CTVmax cells (F). Results represent mean (percentage) ± SD of clonogenic/surviving cells in comparison with untreated cells from triplicate experiments. *P < .05 vs individual treatments, 2-tailed Student t test. (G) Lin−CD34+ FLT3(ITD)-positive cells from 4 AML patients (188, 194, 499, 10KM1950) were left untreated or were treated with AC220 (100 nM), Ola (2.5 μM), and the combination of AC220 + Ola on HS-5 cell monolayers in 1% O2 for 3 days, followed by plating in methylcellulose. Results represent mean (percentage) ± SD of clonogenic cells in comparison with untreated cells from triplicate experiments. *P < .05 vs individual treatment, 2-tailed Student t test.

