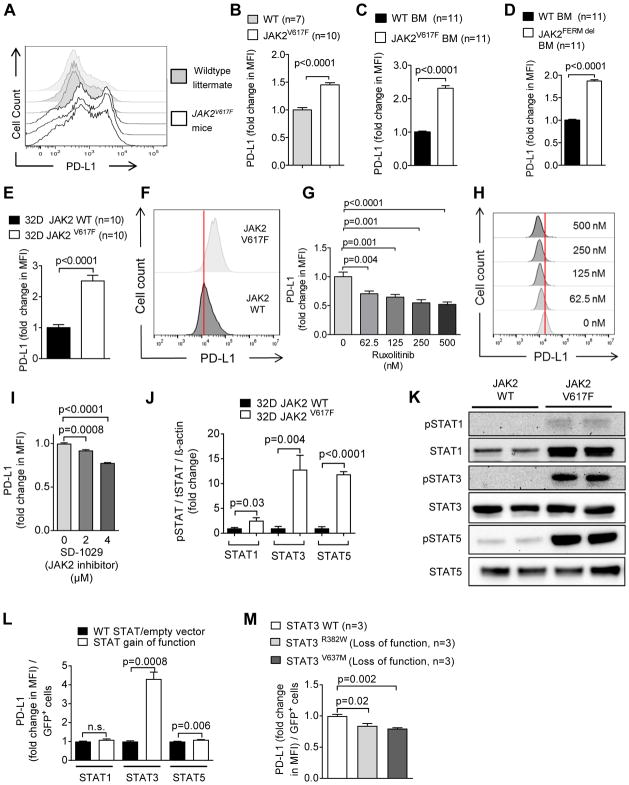
Fig. 1. JAK2 V617F activation increases PD-L1 expression in myeloid cells.
(A) The representative histograms show the expression of PD-L1 on CD41+ platelets from the spleens of wildtype littermate mice (gray, n=3) and JAK2V617F mice (white, n=3). One of three independent experiments is shown.
(B) The bar diagrams show fold change of PD-L1 expression on CD41+ platelets isolated from the spleens of wildtype littermate and JAK2V617F mice. Data are pooled from two independent experiments (WT littermate mice, n=7; JAK2V617Fmice, n=10).
(C, D) The bar diagrams show PD-L1 expression in murine primary BALB/c BM cells isolated from mice on day 4 after treatment with 5-FU, after infection with either GFP+JAK2V617F virus (C) or GFP+-JAK2 virus (deletion of the FERM inhibitory domain) (D). Data are pooled from 11 technical replicates.
(E) The bar diagram shows PD-L1 expression on 32D cells expressing JAK2 wildtype (JAK2-WT, black) or JAK2V617F (white). Data are pooled from three independent experiments, n=10 each group.
(F) The representative histograms show PD-L1 expression on 32D JAK2-WT cells (dark gray) or 32D JAK2V617F cells (light gray).
(G) The bar diagram shows PD-L1 expression on 32D JAK2V617F cells after exposure to ruxolitinib. Data are pooled from three independent experiments.
(H) The representative histograms show PD-L1 expression on 32D JAK2V617F cells after exposure to different concentrations of ruxolitinib.
(I) The graph shows PD-L1 expression on 32D JAK2V617F cells exposed to the specific JAK2 inhibitor SD-1029. Data (n=4 per group) from one of three independent experiments with comparable results are shown.
(J) The bar diagram indicates the ratio of pSTAT1/STAT1/β-actin, pSTAT3/STAT3/β-actin, and pSTAT5/STAT5/β-actin for 32D JAK2-WT or JAK2V617F cells. Pooled data (n=4 per group) from two independent experiments.
(K) The Western blots display STAT1, STAT3, and STAT5 total protein and phospho-STAT1, phospho-STAT3, and phospho-STAT5 in 32D-JAK2-WT or 32D-JAK2V617F cells. The blots are representative of two independent experiments.
(L) The bar diagram displays the fold change of PD-L1 expression (flow cytometry) on 32D cells that were transfected with a vector containing STAT1 (R321G), STAT3 (Y640F), or STAT5 (S711F) with activating mutations (GOF) or the respective WT STATs (for STAT1/STAT3) or empty vector (STAT5). One representative (n=3 each group) of two independent experiments is displayed.
(M) The bar diagram displays the fold change of PD-L1 expression (flow cytometry) on 32DV617F cells that were transfected with a vector containing two different STAT3 loss-of-function mutations (R382W/V637M). Pooled data from two independent experiments (n=3 per group).

