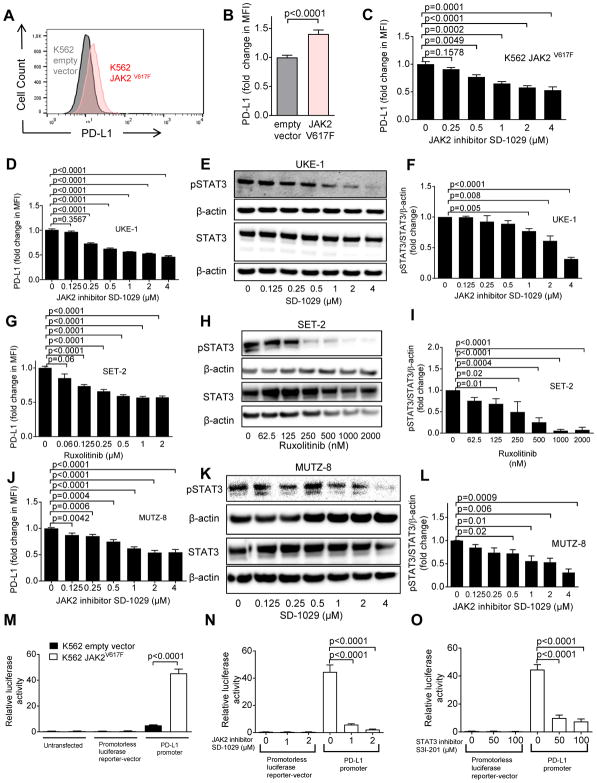
Fig. 2. The mutation JAK2V617F promotes de novo PD-L1 gene transcription in human cells.
(A) The histograms show the MFI for PD-L1 on K562 cells (transfected with empty vector or JAK2V617F vector). One representative experiment of three experiments with a comparable pattern is shown. The analysis was done on GFP+ sorted cells within 3 days after transfection.
(B) The bar diagram displays the fold change of PD-L1 expression (flow cytometry) on K562 cells transfected with empty vector or with JAK2V617F. The data are pooled from 4 independent experiments (n=12 per group).
(C) The bar diagram displays the fold change of PD-L1 expression (flow cytometry) on K562 JAK2V617F cells that were exposed to different concentrations of the JAK2 inhibitor SD-1029. Pooled data from two independent experiments (n=6 at each concentration).
(D) The bar diagram displays the fold change of PD-L1 expression (flow cytometry) for the JAK2V617F-positive cell line UKE-1 treated with the JAK2 inhibitor SD-1029 (n=7 at each concentration).
(E) The Western blots display STAT3 total protein, β-actin and phospho-STAT3 in UKE-1 cells being treated with the JAK2 inhibitor SD-1029. The blots are representative of three independent experiments.
(F) The bar diagram indicates the ratio of pSTAT3/STAT3/β-actin (normalized to 1 in the condition without JAK2 inhibitor) for the cells described in (E). Pooled data from three replicates (n=3 for each concentration).
(G) The bar diagram displays the fold change of PD-L1 expression (flow cytometry) for JAK2V617F positive cell line SET-2 treated with ruxolitinib. Pooled data from three independent experiments (concentration 0 – 0.5 μM: n=12, concentration 1 and 2 μM: n=6).
(H) The Western blots display STAT3, β-actin, and phospho-STAT3 in SET-2 cells being treated with ruxolitinib. The blots are representative of three independent experiments.
(I) The bar diagram indicates the pSTAT3/STAT3/β-actin ratio for cells described in (H). Pooled data from three independent experiments (n=3 for each concentration).
(J) The bar diagram displays the fold change of PD-L1 expression (flow cytometry) for JAK2V617F positive cell line MUTZ-8 that was treated with the JAK2 inhibitor SD-1029 (n=3 for each concentration).
(K) The Western blots display STAT3 total protein, β-actin and phospho-STAT3 in MUTZ-8 cells being treated with the JAK2 inhibitor SD-1029. The blots are representative of three independent experiments.
(L) The bar diagram indicates the ratio of pSTAT3/STAT3/β-actin for cells described in (K). Pooled data from three independent experiments (n=3 for each concentration).
(M) The bar diagram indicates the relative luminescence activity of K562 cells (containing empty vector or JAK2V617F) which were left untransfected or transfected with either a promoterless luciferase reporter-vector pgl4.13 or a reporter vector containing the PD-L1 promoter. Pooled data from three technical replicates (n=6 for each condition).
(N) The bar diagram indicates the relative luciferase activity of K562 JAK2V617F cells transfected with either the promoterless luciferase reporter vector pgl4.13 or the reporter vector containing the PD-L1 promoter and treated with the JAK2-inhibitor SD-1029. Pooled data from three independent experiments (n=6 for each condition).
(O) The bar diagram indicates the relative luminescence activity of K562 JAK2V617F cells transfected with either the promoterless luciferase reporter vector pgl4.13 or the reporter vector containing the PD-L1 promoter and treated with the STAT3 inhibitor S3I-201. Pooled data from three independent experiments (n=6 for each condition).

