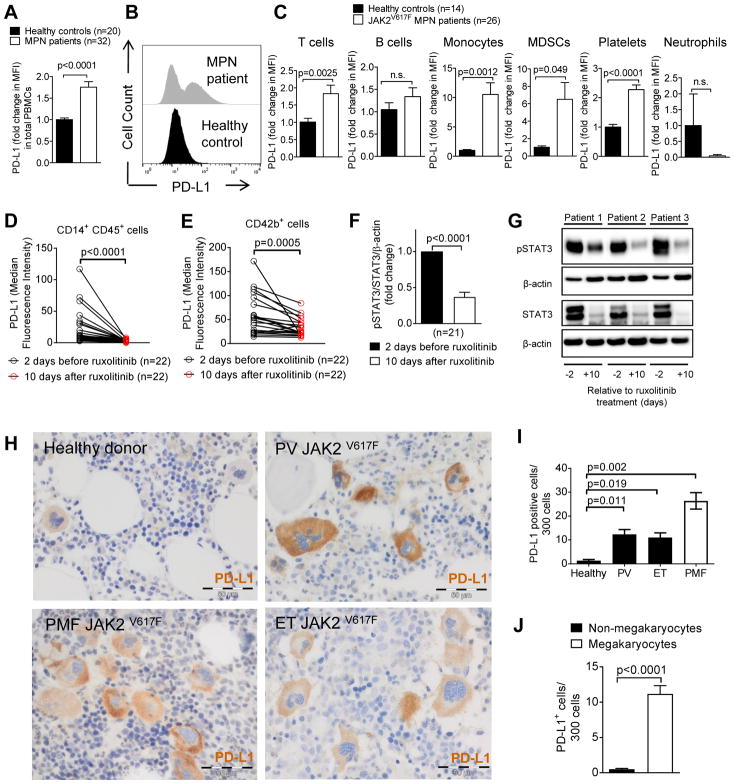
Fig. 3. PD-L1 is expressed on different cell types in MPN patients.
(A) The bar diagram indicates the expression of PD-L1 on peripheral blood cells and platelets from healthy volunteers or MPN patients.
(B) The histograms show PD-L1 expression on peripheral blood cells and platelets in healthy individuals or MPN patients as described in (A).
(C) The bar diagrams show PD-L1 expression in different cell types: T cells (CD3+), B cells (CD19+), monocytes (CD11b+CD14+), MDSCs (CD11b+CD33+CD14−), platelets (CD42b+), and neutrophils (CD11b+CD15+) from multiple MPN patients and healthy controls. Data were normalized to the PD-L1 MFI of healthy controls set as 1.
(D, E) The diagrams show PD-L1 expression (MFI) in CD14+ monocytes (D) and CD42b+ platelets (E) from MPN patients on day 2 before ruxolitinib-treatment and 10 days after start of ruxolitinib. Each data point indicates the measurement of an individual patient at the indicated time point. The P value was determined by using the Wilcoxon matched-pairs signed rank test.
(F) The bar diagram shows the pSTAT3/STAT3/β-actin ratio within PBMCs from MPN patients on day 2 before ruxolitinib treatment and 10 days after start of ruxolitinib. Pooled results from 21 patients.
(G) The Western blots show pSTAT3 and STAT3 protein amounts within PBMCs from 3 representative MPN patients on day 2 before ruxolitinib treatment and 10 days after start of ruxolitinib.
(H) Displayed are representative BM biopsies from a healthy control and different MPN patients with verified JAK2V617F mutations. PD-L1+ cells appear in brown. The scale bar represents 50 μm.
(I) The bar diagram displays the number of PD-L1+ cells out of 300 cells detected in BM biopsies from healthy volunteers or from multiple patients with the indicated MPN type. PV: polycythemia vera, ET: essential thrombocythemia, PMF: primary myelofibrosis.
(J) The bar diagram displays the number of PD-L1+ megakaryocytes versus all PD-L1+ non-megakaryocyte cells detected out of 300 cells examined in BM biopsies of patients with JAK2-mutant MPN. Data are pooled from 39 patients.

