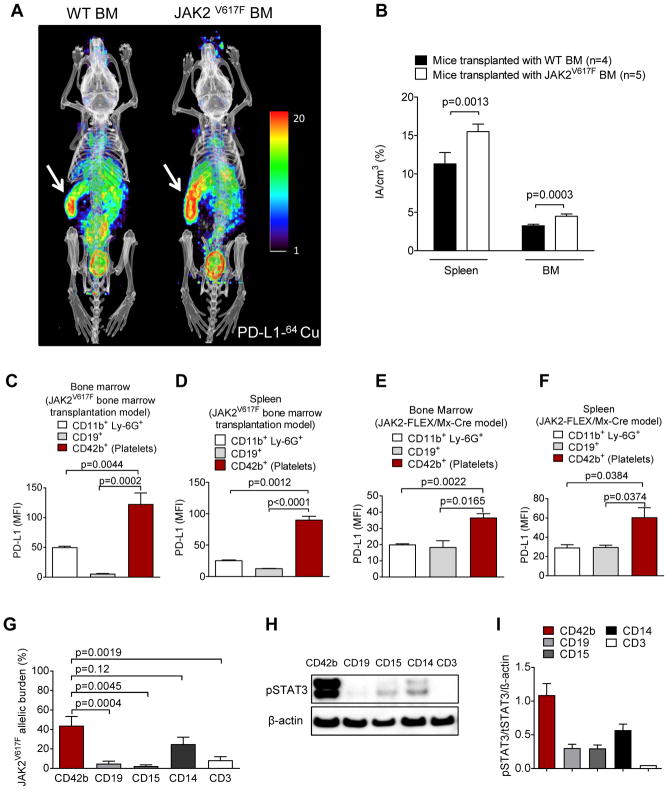
Fig. 4. PD-L1 expression is found in the spleen and the bone marrow of mice transplanted with JAK2V617F transduced bone marrow.
(A) Two representative mice imaged by PET/CT using a 64Cu-labeled anti-PD-L1 antibody are shown. BALB/c mice had received either JAK2V617F-transfected (right) or WT syngeneic BM (left) after total body irradiation (TBI, 6.5 Gy). The signal intensity indicates areas with high PD-L1 expression. Arrows point towards the spleen (high signal intensity). The image is representative of 4 mice per group with comparable signal patterns.
(B) The bar diagram shows the signal intensity in the indicated organs of mice transplanted as described in (A). Data are pooled from 4 or 5 mice per group.
(C, D) The bar diagram shows the MFI for PD-L1 on different cells and platelets in the BM (C) or spleen (D) of mice transplanted as described in (A). n=5 each group.
(E, F) The bar diagram shows the MFI for PD-L1 on different cells and platelets in BM (E) and spleen (F) of JAK2-FLEX/Mx-Cre mice (n=3 each group).
(G) The bar diagram shows the JAK2V617F allele burden in different cell populations isolated by cell sorting from 15 MPN patients. The JAK2V617F allele burden was determined by qPCR (n=15 each group).
(H) The Western blot shows the amounts of pSTAT3 and STAT3 in different cell populations isolated by cell sorting from a representative polycythemia vera patient.
(I) The bar diagram shows the ratios of pSTAT3/STAT3/β-actin in different cell populations isolated by cell sorting from multiple MPN patients (n=5 for CD42b, CD19, CD15, and CD3, n=3 for CD14).

