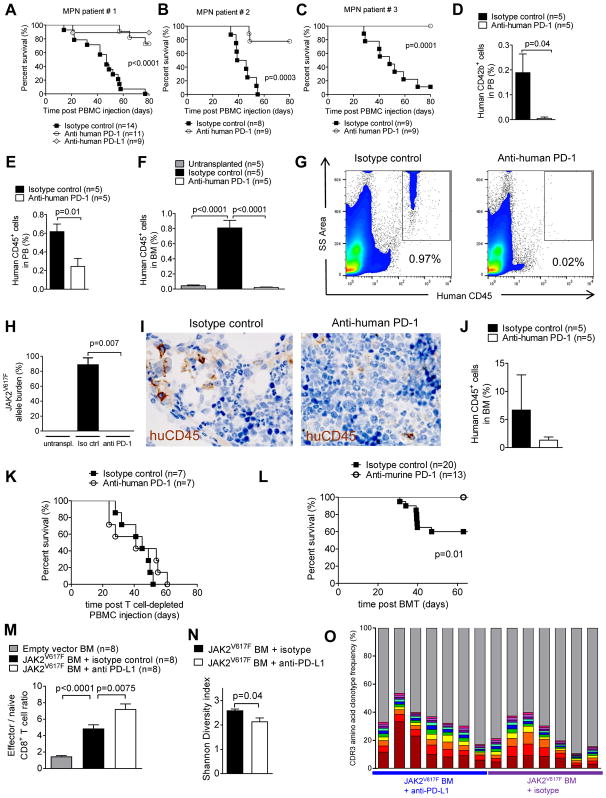
Fig. 5. PD-1 blockade improves survival in MPN mouse models.
(A–C) The survival of RAG2−/−Il2r−/− mice after intravenous transfer of human PBMCs from patient #1 (A), patient #2 (B), and patient #3 (C) (table S2) is shown. Mice were treated with 250 μg of either isotype-control Ab, or anti-human PD-1 Ab, or anti-human PD-L1 Ab on day 8 after PBMC injection. Pooled data from three independent experiments.
(D, E) The bar diagram shows the percentage of human CD42b+ platelets (D) or human CD45+ cells (E) in the peripheral blood of RAG2−/−Il2r−/− mice transplanted with PBMCs from MPN patient #1. The analysis was performed on day 21 after intravenous transfer of human PBMCs.
(F) The bar diagram shows the percentage of human CD45+ cells determined by flow cytometry in the BM of untreated RAG2−/−Il2r−/− mice. RAG2−/−Il2r−/− mice had received intravenous transfer of human PBMCs from patient #1 (table S2) and were treated with isotype Ab or anti-human-PD-1 (250 μg, day 8). The analysis was performed on day 39 after intravenous transfer of human PBMCs.
(G) Representative FACS plots showing the percentage of human CD45+ cells in BM of RAG2−/−Il2r−/− mice transplanted and treated as described in (F).
(H) The bar diagram shows the JAK2V617F allele burden in BM harvested from RAG2−/−Il2r−/− mice treated as described in (F).
(I) Representative pictures of human CD45+ cells (brown) in the BM harvested from RAG2−/−Il2r−/− mice treated as described in (F). The scale bar size represents 50 μm.
(J) Shown is the quantification of the CD45+ cells in BM harvested from RAG2−/−Il2r−/− mice treated as described in (F).
(K) Survival of RAG2−/−Il2r−/− mice after intravenous transfer of human PBMCs depleted of CD3+ T cells from patient #1 (table S2) is shown. Mice were treated with isotype control or anti-human PD-1 (250 μg) on day 8 after transplantation. Data are pooled from two independent experiments.
(L) Survival of BALB/c mice, which had received JAK2V617F-transfected syngeneic BM after TBI and isotype control Ab or anti-PD-1 Ab. Data are pooled from two independent experiments.
(M) The bar diagrams show the ratio of effector/naive CD8+ T cells in spleens isolated from mice described in (L) on day 19 after transplantation (each group n=8).
(N) The mean diversity index of TCRα complementarity determining region 3 (CDR3) amino acid sequences for isotype control Ab or anti-PD-1 Ab groups is shown. Error bars represent standard error of the mean.
(O) The abundance of the CDR3 amino acid clonotype frequency of the ten strongest clones according to variable αβ-TCR genes for isotype control Ab or anti-PD-1 Ab groups is shown. Each bar represents an individual mouse; different colors display different clones.

