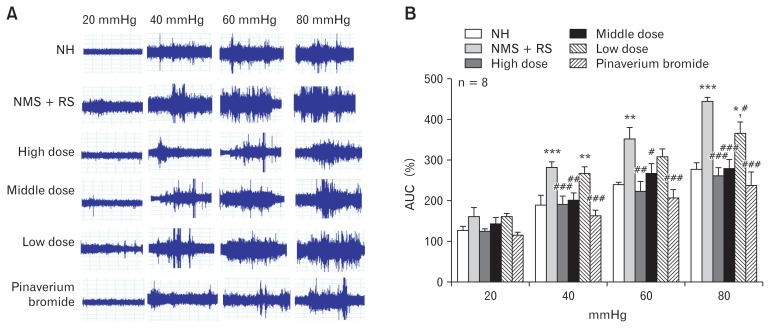
Figure 1.
Magnitude of visceromotor response to colorectal distention (CRD) in 6 groups. (A) Typical electromyographic (EMG) tracings of the 6 groups. (B) Effect of Fengliao-Changweikang (FLCWK) on the area under the curve (AUC) (means ± SE, n = 8). *P < 0.05, **P < 0.01, ***P < 0.001 versus normal control (no handling [NH]) group; #P < 0.05, ##P < 0.01, ###P < 0.001 versus neonatal maternal separation (NMS) + restraint stress (RS) group.

