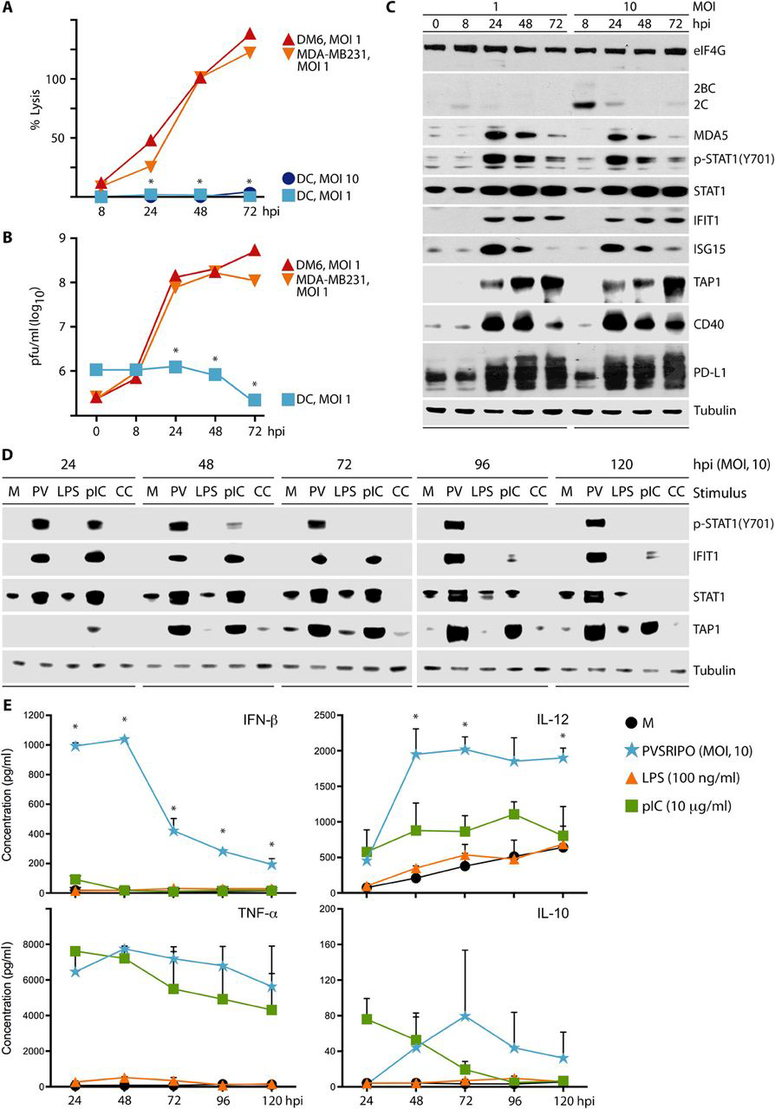
Fig. 4. PVSRIPO infection of DCs is sublethal, marginally productive, and induces sustained pro-inflammatory cytokine production.

Analysis of percent lysis (as measured by LDH release) (A) and viral progeny (B) after PVSRIPO infection of DCs compared to PVSRIPO infection of DM6 and MDA-MB231 cells. (A and B) Asterisks denote statistical significance comparing pooled cancer cell line data to DC values by ANOVA protected HSD test; error bars depict SEM. (C) Dose-dependent PVSRIPO infection (viral protein 2C), type I IFN responses, and lack of cytotoxicity (PARP and eIF4G) in primary human DCs shown by immunoblot. (D and E) iDCs were untreated (mock; M) or treated with PVSRIPO (PV; MOI=10), LPS (100 ng/ml), poly(I:C) (10 μg/ml), or maturation cytokine cocktail (CC) as shown. Cells and supernatant were harvested at the designated intervals. (D) Cell lysates were analyzed by immunoblot for the IFN response and DC activation proteins. (E) ELISA was used to measure IFN-β, TNF-α, IL-12, and IL-10 in DC supernatants after treatment. Data represent cumulative cytokine release at the designated time point. The mean of 2 experiments is shown for each time point. Asterisks denote PVSRIPO mediated cytokine production that is significant compared to all other groups using ANOVA protected Tukey’s HSD test. Repeat assays and magnified view of these data are presented in fig. S3.
