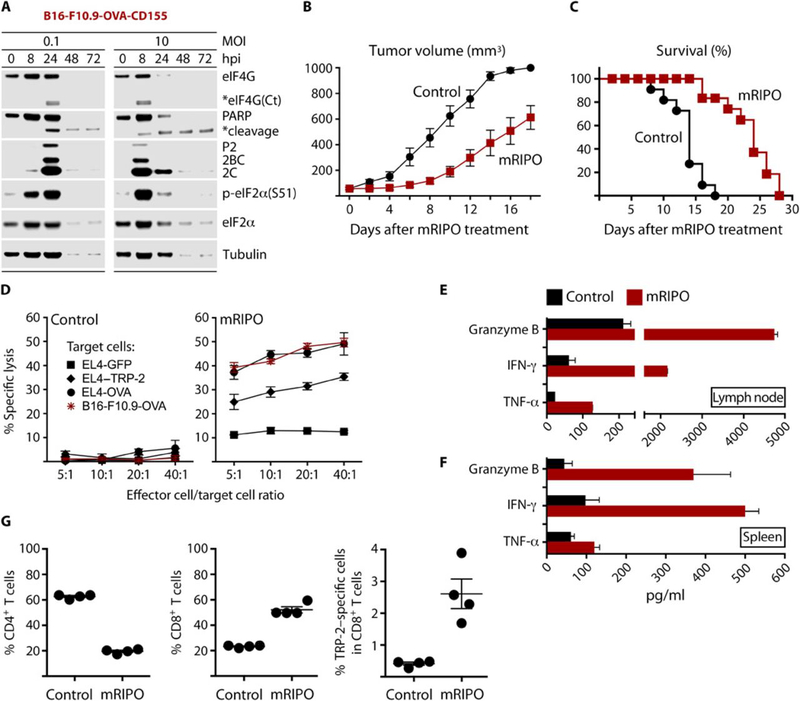
Fig. 7. mRIPO therapy restricts tumor growth and produces antigen-specific antitumor immunity.

(A) Cytopathogenicity profile of mRIPO in B16-F10.9-OVA-CD155 cells. (B and C) Subcutaneous B16-F10.9-OVA-CD155 tumors were injected with either control (DMEM) or mRIPO (20 μl) when they reached a volume of ~50–100 mm3. Tumor volume was measured (n=11 per group) on the days indicated (B); mice were euthanized when tumors reached 1000 mm3 (C). Data are from two pooled assays. Tumor growth curves were compared using multiple t-tests with Holm-Sidak multiple comparison post-test; p≤0.005 starting on day 6. Comparison of survival curves between the 2 groups was performed using the log-rank test (Mantel–Cox test), p<0.0001. Median survival day: control=14; mRIPO=24. (D) Tumor-draining inguinal lymph nodes were harvested from mice (n=4) 7 days after treatment with DMEM or mRIPO and restimulated with antigen-expressing cells for 5 days. Restimulated cells were tested for lytic activity against B16-F10.9-OVA cells or EL4 cells electroporated with RNA encoding GFP (control), TRP-2 (melanoma antigen), or OVA. (E) Supernatant from the CTL assay (D) was tested for markers of T cell activation and lytic activity by ELISA. (F) Tumor-bearing mice were treated with DMEM or mRIPO, and spleens were harvested 14 days after treatment (n=4). Splenocytes from individual mice were co-cultured with B16-F10.9-OVA-CD155 cells (5:1 ratio; 48 h); supernatant was tested as in (E). (G) Tumor-draining inguinal lymph nodes were harvested after treatment with DMEM or mRIPO and individually restimulated in vitro. After 5 days, restimulated cells were analyzed for CD4 and CD8 T cells by flow cytometry. TRP-2-specific response was assessed using a H-2Kb TRP-2 tetramer (right panel). TRP-2 specific responses were compared using student t test, with p<0.05 considered significant. Fig. S8D shows representative flow cytometry analyses of T cells and TRP-2-specific T cells (out of 4 tested per group).
