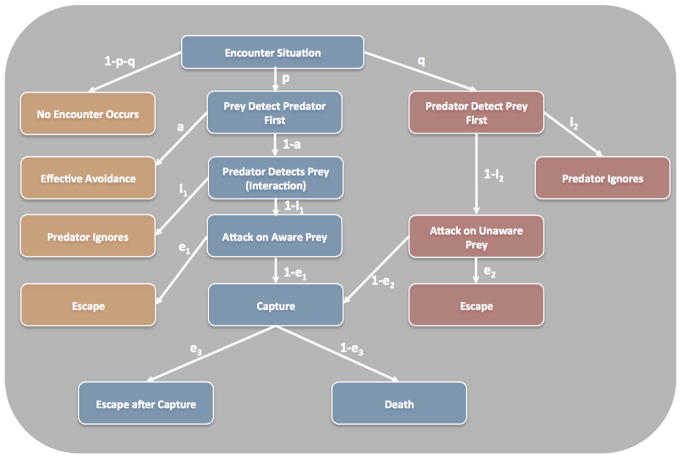
Fig. 1.
Lima and Dill’s Predator-Prey Model. Flow chart displaying the permutations of a predator-prey encounters. The symbols signify the conditional probabilities of each step of the pathway. a= avoid; e = escape; i = ignore; p=probability that the prey detects the predator first; q = probability that the predator detects the prey first [11].

