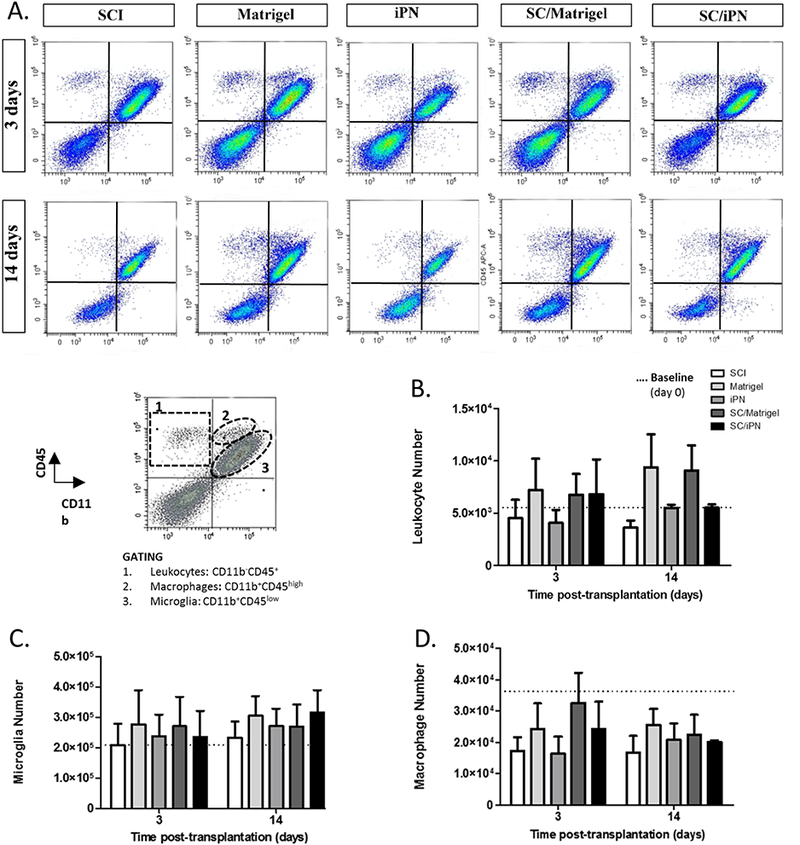
Figure 3.

A. Representative images of flow cytometry analysis of subacute changes in immune cell number after SC transplantation and/or iPN or Matrigel injection, at 3 and 14 days post-transplantation. B-D. Quantification of the total number of leukocytes (B), microglia (C), and macrophages (D). Baseline levels measured before transplantation are represented by a dashed line. Results expressed as mean ± SEM.
