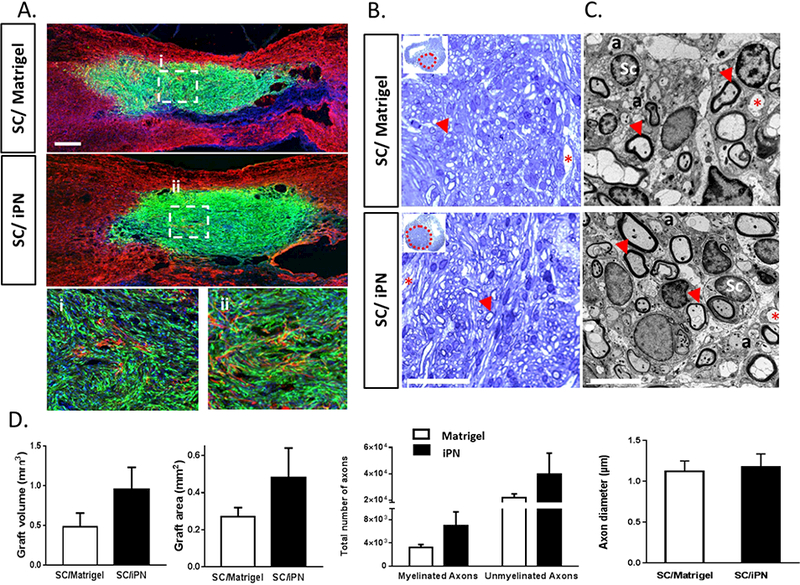
Figure 6.

A. Confocal micrographs of sagittal spinal cord sections at 8 weeks posttransplantation of SCs in either Matrigel or iPN. Transplanted SCs (GFP, in green) and astrocytes (GFAP, in red) are shown. Cell nuclei are also visible (Hoechst, in blue). Bar = 500μm. Higher magnifications of the central areas of SC grafts in Matrigel (i) or iPN (ii) are shown. B. Bright field micrographs of SCs in either Matrigel or iPN in semi-thin, toluidine blue-stained coronal sections of spinal cord at 8 weeks post-transplantation. SCs were transplanted either in Matrigel or iPN. Graft areas are delineated by a dashed red line. Arrows indicate myelinated axons; asterisks indicates blood vessels. Bar = 50μm C. Transmission electron micrographs of the epicenter of the grafts. Legend: Sc: Schwann cell nucleus; a: unmyelinated axon. Arrows indicate myelinated axons; asterisks indicate blood vessels. Bar = 5μm. D. Quantification of graft volumes and areas, and number and diameter of axons in the graft. Results expressed as mean ± SEM.
