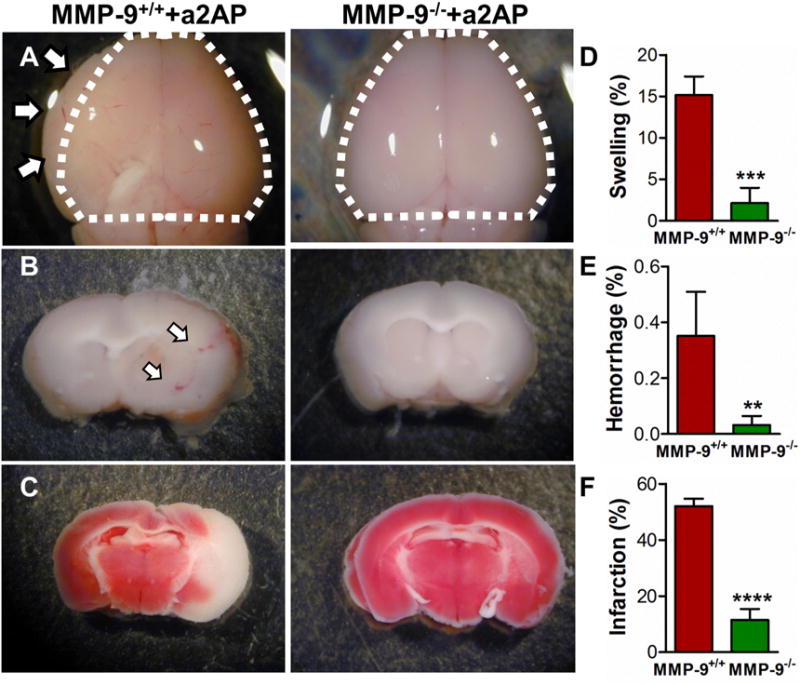
Figure 2. Effect of increased blood α2-antiplasmin levels on brain swelling, hemorrhage and cerebral infarct in MMP-9+/+ vs MMP-9−/− mice.

MMP-9+/+ and MMP-9−/− mice were intravenously supplemented with α2-antiplasmin prior to MCA thromboembolic stroke. Brain tissue was examined 24 h later. (A) Representative images of brain swelling in the ischemic hemisphere. To visualize the swelling, dotted lines outline the area of the contralateral non-ischemic hemisphere and arrows indicate visible brain swelling beyond that margin in the ischemic hemisphere. (B) Brain hemorrhage (red color; white arrows) in 2 mm brain sections before TTC staining. (C) Cerebral infarction (white) after TTC staining. The bar graphs show (D) quantitation of swelling (%), (E) hemorrhage (%) and (F) infarct volume (%) in the ischemic vs non-ischemic hemisphere. N=5-7 per group, **p<0.01***p<0.001, ****p<0.0001.
