
Figure 5. Effects of MMP-9 deficiency on fibrin(ogen) deposition in the brain after stroke.
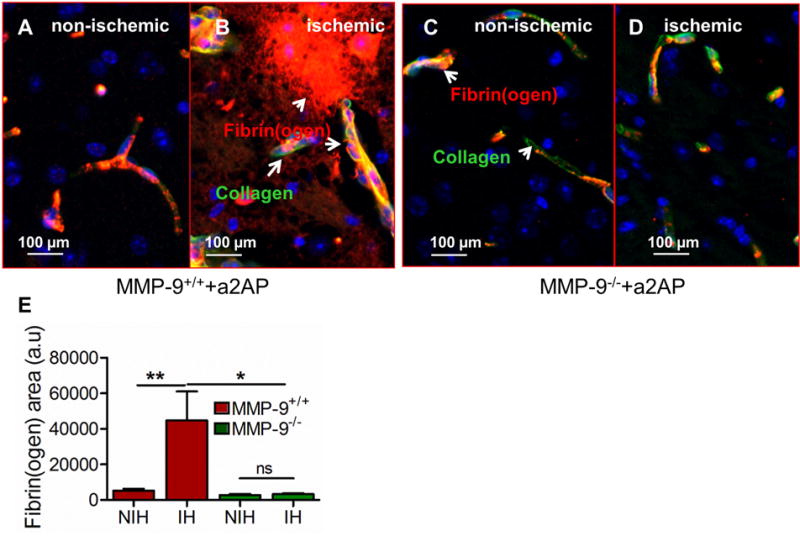
(A, B) Merged immunofluorescence images of fibrin(ogen) deposition (red, arrows), type IV collagen (green, blood vessels) or both (yellow) in the ischemic (A) vs non-ischemic hemisphere (B) of MMP-9+/+ mice with increased α2-antiplasmin. Blue color represents DAPI stained nuclei. (C, D) Representative (100 μm) images showing fibrinogen deposition in the ischemic (C) vs non-ischemic hemisphere (D) in MMP-9−/− mice with increased α2-antiplasmin. (E) Average area of fibrin(ogen) deposition in the ischemic (IH) vs the non- ischemic (NIH) hemisphere in 8-10 images from each hemisphere in MMP-9+/+ and MMP-9−/− mice. N=4-6, **p<0.01, *p<0.05, ns- non significant.