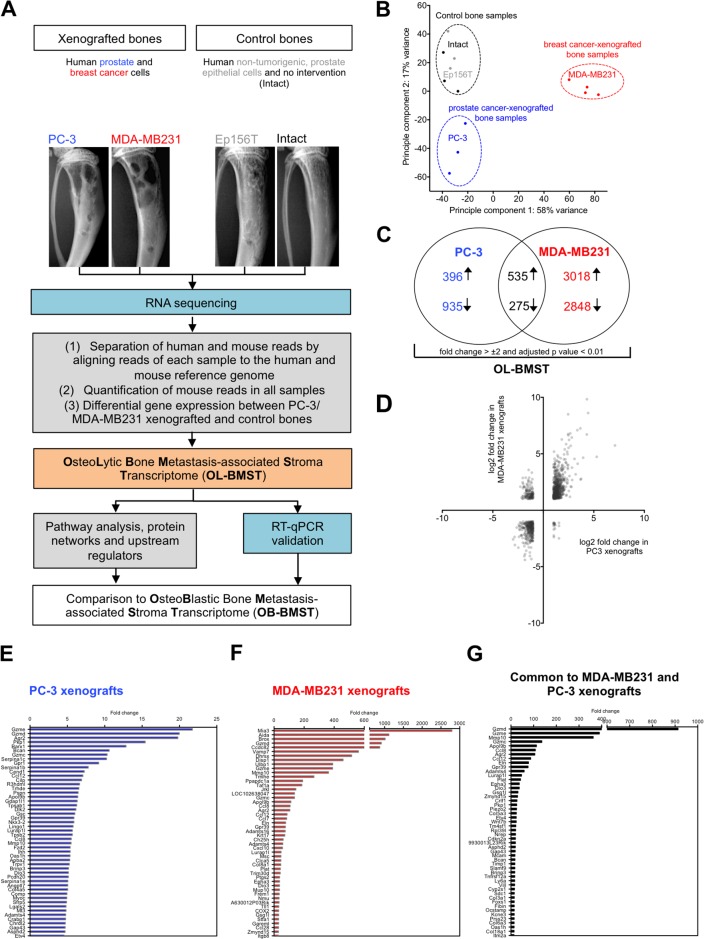
Figure 1. Bones xenografted with osteolytic prostate and breast cancer cells alter the gene expression profile of the bone/bone marrow stroma.
(A) Flow chart outlining experimental (blue) and bioinformatic (grey) steps used to define the stroma response signature in osteolytic bone metastasis (OL-BMST) (orange). (B) Principle component analysis showing the sample distribution of prostate (blue - PC-3 cell line) and breast (red - MDA-MB231 cell line) cancer cell line xenografted bones, Ep156T xenografted bones (grey) and intact bones (black). Each dot represents one mouse. (C) Venn diagram showing the number of overlapping and unique genes differentially expressed in PC-3 (p value < 0.01) and MDA-MB231 (p value < 0.01) xenografted bones versus controls. The sum of differentially expressed genes is referred to as the OL-BMST. (D) Scatter plot showing log2 fold change of differentially expressed genes in PC-3 and MDA-MB231 xenografts. (E) Top 50 annotated up-regulated genes in the PC-3 xenografts. (F) Top 50 annotated up-regulated genes in the MDA-MB231 xenografts. (G) Top 50 annotated up-regulated genes common to both, PC-3 and MDA-MB231 xenografts.

