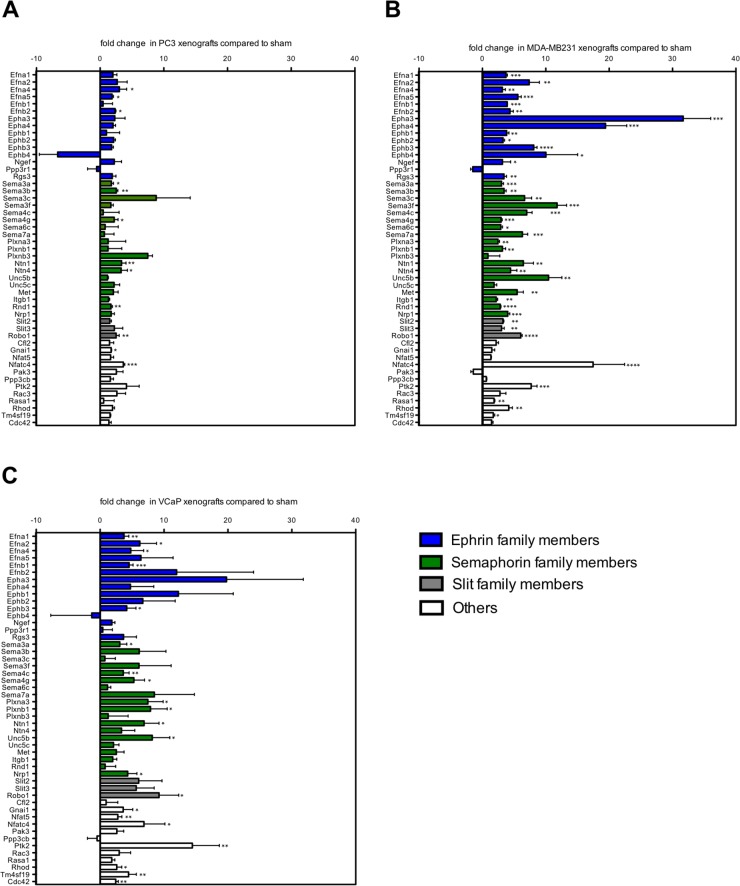
Figure 3. A subset of axon guidance molecules is exclusively induced in osteolytic bone metastasis.
Fold change expression levels of axon guidance genes in osteolytic (PC-3 and MDA-MB231 xenografts) and osteoblastic (VCaP xenografts) bone metastasis compared to sham-operated animals. Expression levels of ephrin family members (blue bars), semaphorin family members (green bars), Slit family members (grey bars) and others (white bars) in (A) PC-3, (B) MDA-MB231 and (C) VCaP xenografts. Values are shown as fold change (mean ± SD) relative to sham-operated animals. *, P < 0.01; **, P < 0.001; ***, P < 0.0001; ****, P < 0.0001.

