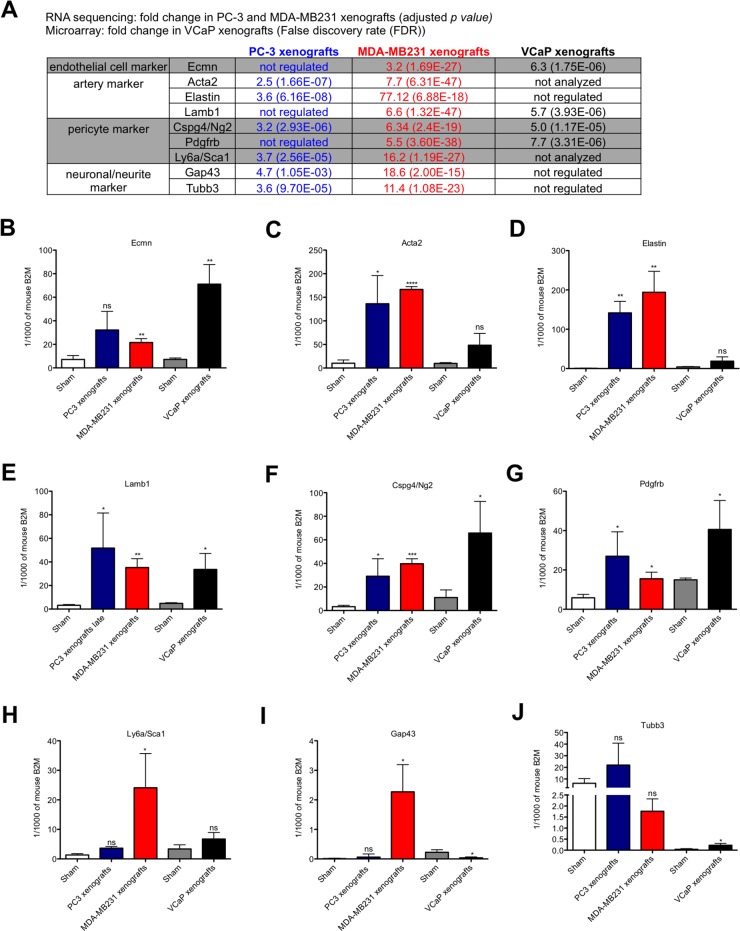
Figure 4. Expression analysis of endothelial cell, artery, pericyte and neuronal/neurite markers in osteolytic and osteoblastic bone metastasis.
(A) Fold change of genes, associated to endothelial cells, arteries, pericytes and neurons/neurites, measured by RNA sequencing (for PC-3 and MDA-MB231 xenografts versus controls) or microarray data (for VCaP xenografts versus controls). B-J. Relative expression levels of endothelial cell (B), artery (C-E), pericyte (F-H) and neuron/neurite (I and J) markers in osteolytic (PC-3 and MDA-MB231 xenografts) and osteoblastic (VCaP xenografts) bone metastasis and corresponding sham-operated animals. Expression levels are shown for PC-3 (blue bar), MDA-MB231 (red bar), VCaP (black bar) xenografts and corresponding sham-operated animals (white bar: sham-operated animals of PC3 and MDA-MB231 xenografts models; grey bar: sham-operated animals of VCaP xenografts). Values for each gene is shown as relative expression to mouse B2M (mean ± SD). *, P < 0.01; **, P < 0.001; ***, P < 0.0001; ****, P < 0.0001, ns - not significant.

