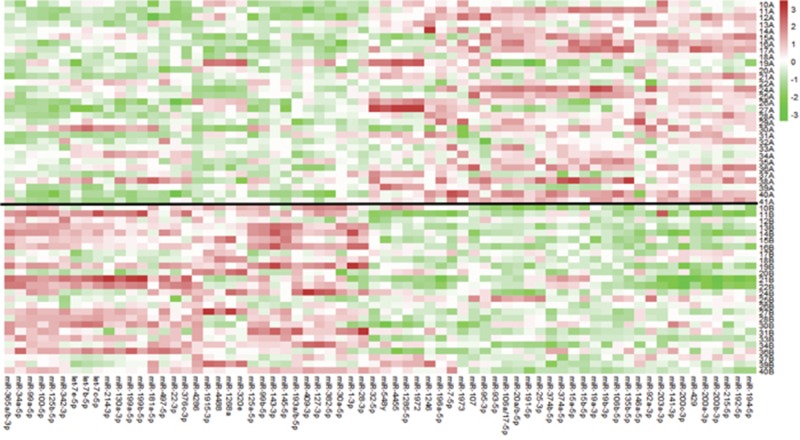
Figure 2. Heat map of differentially expressed miRNAs between pre-therapy and post-therapy tumor samples in patients with pIR.
68 miRNAs were identified (bottom axis) using a linear mixed effect model analysis (using FDR<0.05). The red colors indicate higher expression for a particular miRNA, while the green colors represent lower expression. The black line divides the patient samples between pre-therapy (above black line, “A” samples) and post-therapy (below black line, “B” samples) samples. For example, miR-4286 is predominantly green in pre-therapy samples and red in post-therapy samples, indicating a significant increase in expression in post-therapy samples. miRNA expression values are normalized to the average value (0) using z-score normalization methods, where over-expression of a particular miR is shown in red, no change shown in white, and under-expression shown as green.

