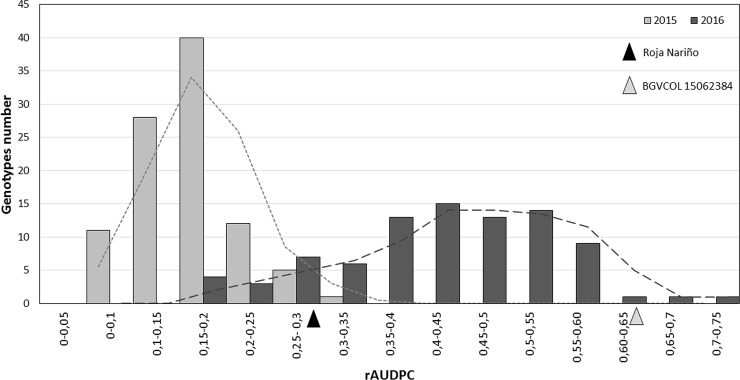
Fig 1. Histogram of severity of Phythopthora infestans.
The x-axis shows the relative area under the disease progress curve (rAUDPC) and the y-axis the number of genotypes can be observed. The dash lines indicate the average trend for each year. The black and grey triangles indicate the phenotypic parent values of Roja Nariño and BGVCOL 15062384 in 2016, respectively.

