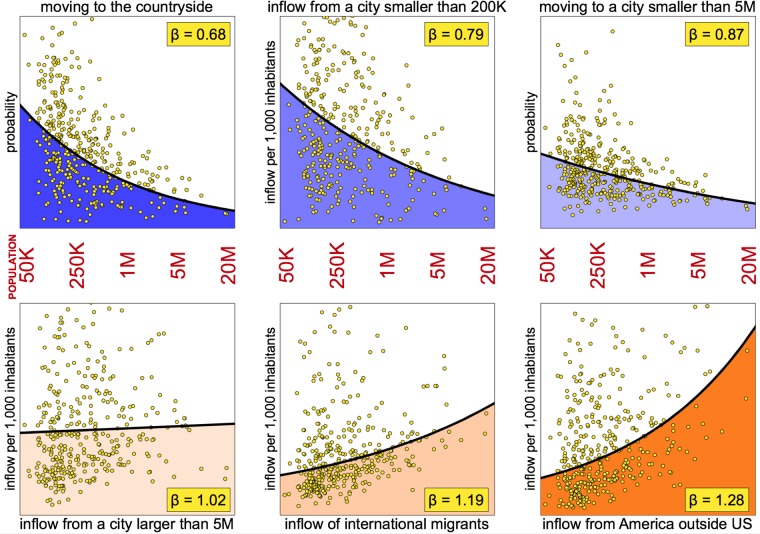
Fig 1. Selected scaling relationships fitted to the data.
The dots represent data on each of the 385 cities in the US with its size on the horizontal axis and its corresponding figures for migration given on the vertical axis given in different units (as a probability or as the inflow of migrants per 1,000 inhabitants). Also plotted on the same diagrams are the results of the scaling relationship fitted to the data with the coefficient given in each case. Top panel: three sublinear relationships. Bottom Panel: three superlinear relationships. A coefficient , as establish in the diagram on the left in the bottom panel (for the inflow from a city larger than 5 million), means that city size has negligible impact on that flux. This establishes the approximate city size where a phase transition occurs.

