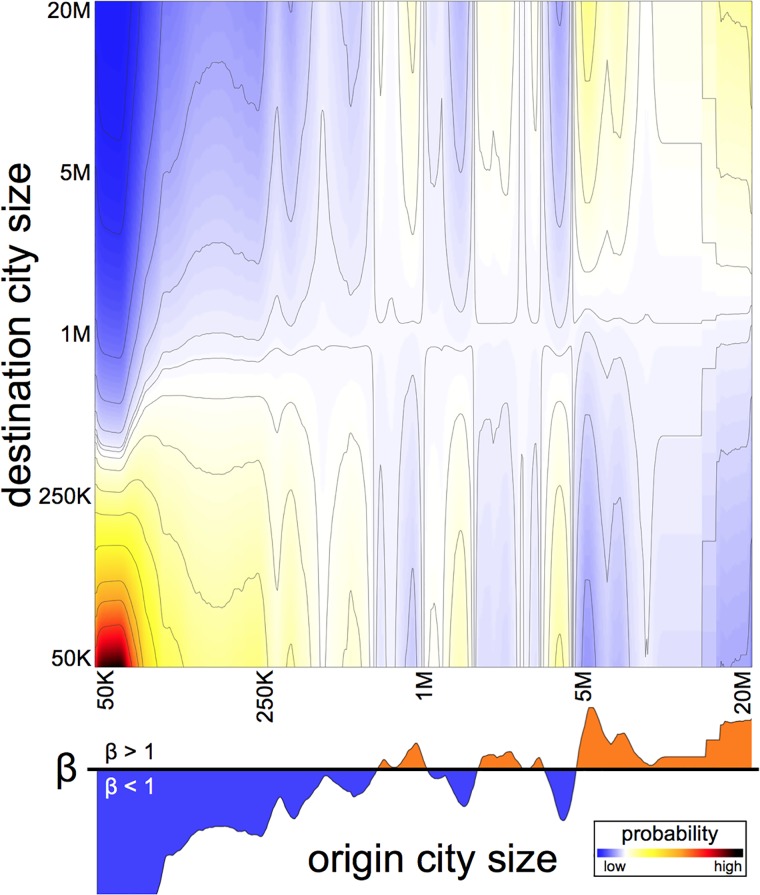
Fig 2. Probability of migration conditional on city size.
Probability of migrating from a city of a given size (horizontal axis) to a city of a given size (vertical axis). The fitted values of according to the city size (plotted in the lower panel) indicates if the probability of migrating to a destination with a given size follows a sublinear (, in blue) or superlinear (, in orange) behaviour. For example, we observe that if the city of origin is larger than 4 million inhabitants, then the probability of migration follows a superlinear behaviour. In contrast, a strong sublinear behaviour is observed for small cities, particularly if the city has less than 100,000 inhabitants.

