
Fig 1. Frequency of contaminated pollen trap samples (n = 281) separated for each site overall years.
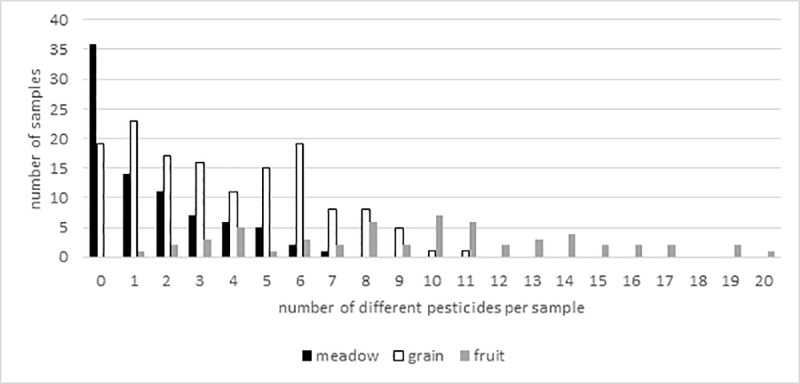
“Meadow” and “grain” were sampled from 2012–2016, “fruit” was sampled 2012–2014.
Official websites use .gov
A
.gov website belongs to an official
government organization in the United States.
Secure .gov websites use HTTPS
A lock (
) or https:// means you've safely
connected to the .gov website. Share sensitive
information only on official, secure websites.
“Meadow” and “grain” were sampled from 2012–2016, “fruit” was sampled 2012–2014.