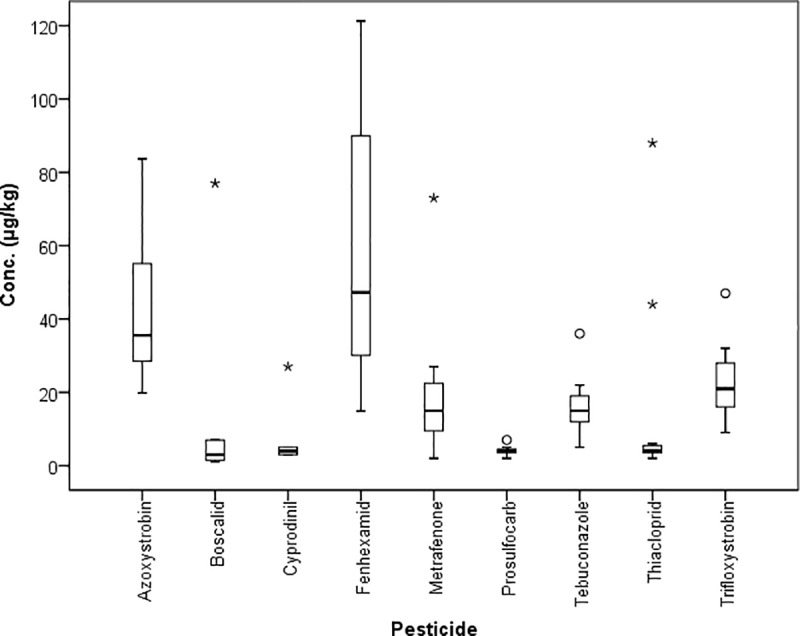
Fig 3. Box-and-whisker-plot of the range of concentrations (μg/kg) of pesticides being identified in at least 8 sub-fractions of the composite sample (06.06.2013) of “fruit” site.

Extreme concentrations exceeding 120 μg/kg: azoxystrobin 567.8 μg/kg, boscalid 207.5 μg/kg, cyprodinil 452.3 μg/kg, fenhexamid 4,452.4 μg/kg, tebuconazole 2,589.3 μg/kg, trifloxystrobin 589.4 μg/kg. Circles and stars indicate outliers.
