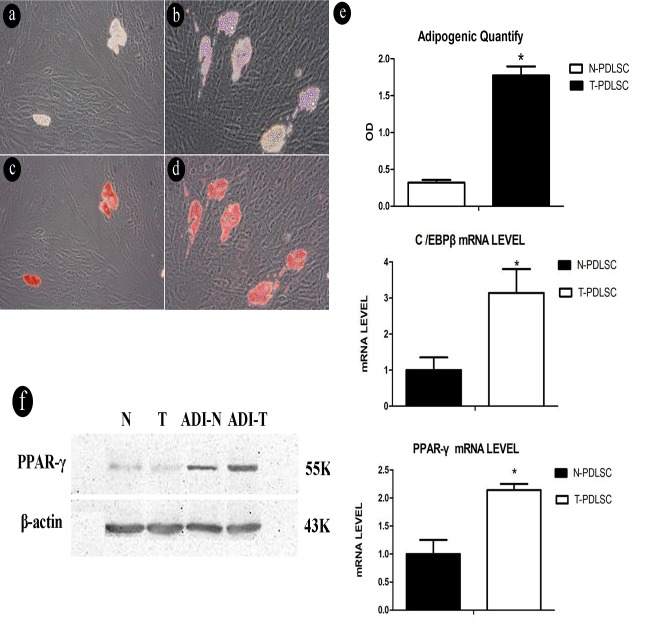
Fig 2. Comparison of lipid droplets formation between normal cell and experimental cell group after adipogenic induction.
(2a) Control group before stains, (2b) Experimental group before stains, (2c) Control group after stains, (2d) Experimental group after stains, (2e) Quantitative analysis of isopropanol and the levels of C/EBP beta and PPAR- gamma mRNA were elevated in the experimental group compared with the control group(*p<0.05), (2f) after adipogenic induction, the levels of PPAR-γ protein expression were elevated in the experimental group compared with the control group. N-PDLSC represents normal cell group, and T-PDLSC represents cells were treated with 25 mmol/L glucose.

