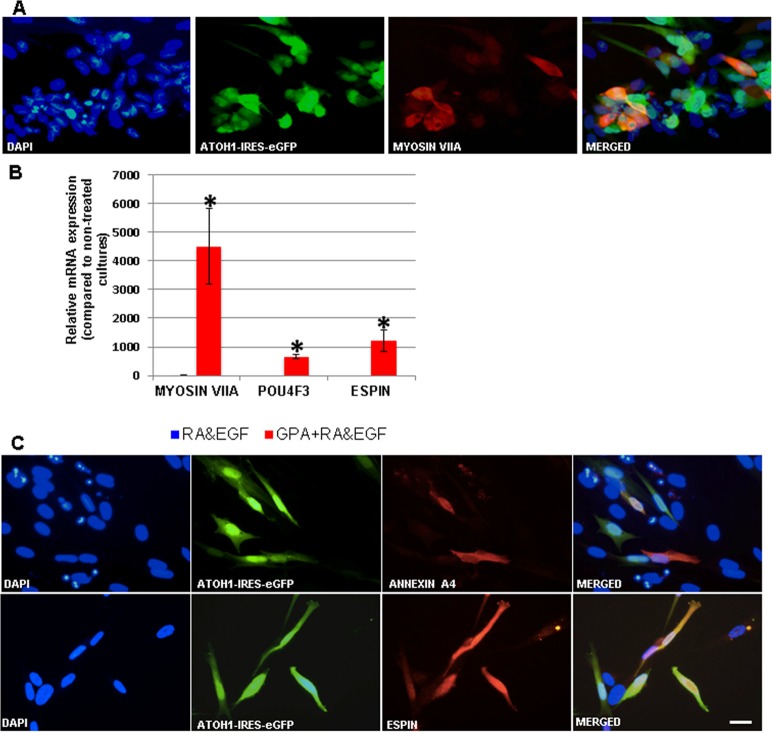
Fig 5. Induction of HC genes in GPA hFIBs grown for two weeks in RA&EGF.
(A) Induction of MYOSIN VIIA protein expression visualized by immunocytochemistry. (B) Relative mRNA expression of the endogenous genes MYOSIN VIIA, POU4F3 and ESPIN, as measured by qPCR analysis. (C) Induction of ANNEXIN A4 and ESPIN protein expression visualized by immunocytochemistry. Note that due to the very high increase in mRNA levels in GPA-infected samples the low levels of mRNAs detected in RA&EGF control samples were barely visualized in the graph in (B). Asterisks: p-value<0.05; scale bar: 20μm.

