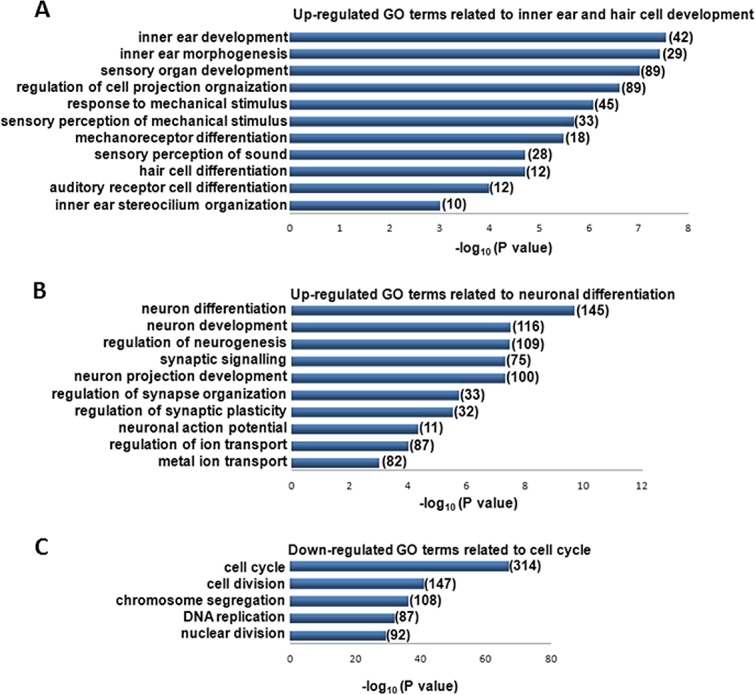
Fig 6. Gene ontology analysis.

Performed using the PANTHER functional annotation tool for genes significantly up- or downregulated (fold change >2, P<0.01) in fibroblasts transduced with GPA and differentiated towards the HC lineage relative to undifferentiated fibroblasts. The number of upregulated genes included within each gene ontology functional term is shown.
