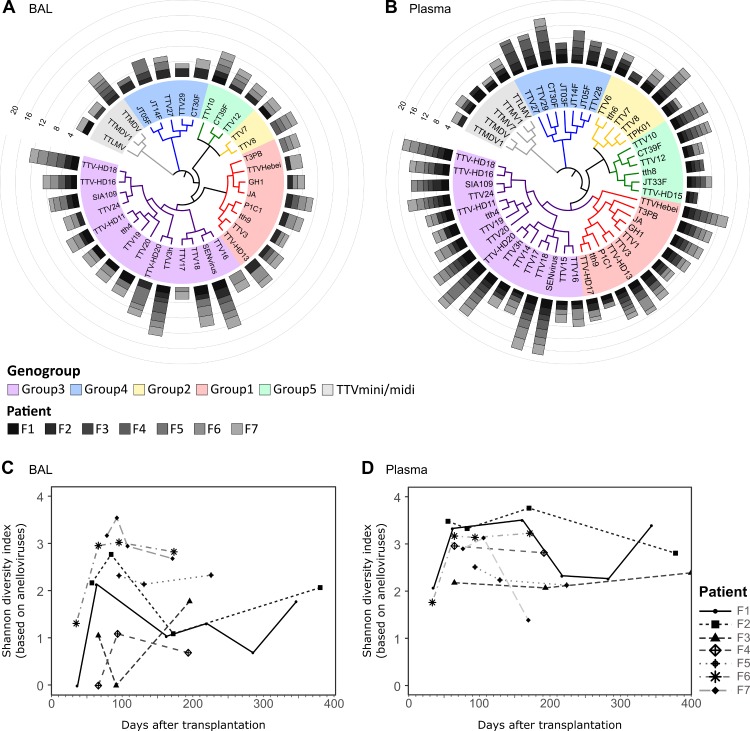
Fig 3. Abundance and diversity of anellovirus strains in BAL and plasma.
(A) and (B) Average abundance of anellovirus strains found over all time points in BAL and plasma samples of LTRs. The strains are shown according to phylogenetic similarity and grouped by genogroup. Bar height indicates Log10 abundance (reads per million). (C) Shannon diversity indexes of LTR BAL samples based on TTV strains. (D) Shannon diversity indexes of LTR plasma samples based on TTV strains.

