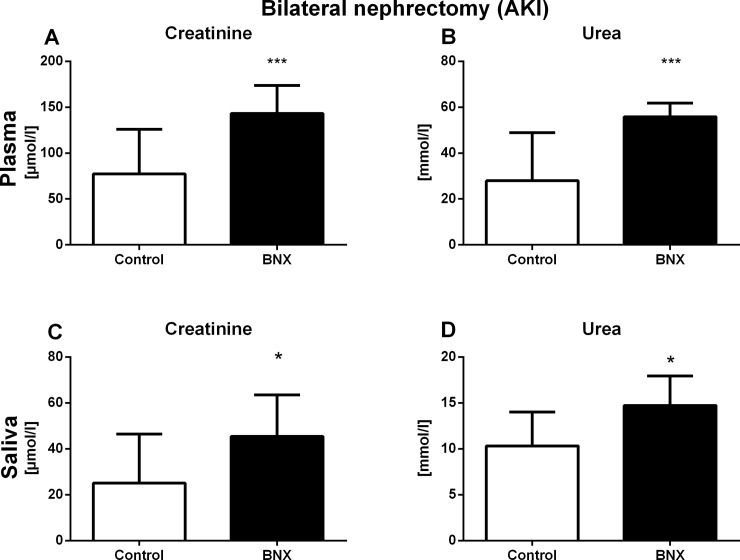
Fig 1. Plasma and salivary concentrations of creatinine and urea in AKI.
Concentration of plasma (A) creatinine and (B) urea, and salivary (C) creatinine and (D) urea 24 hours after AKI induction. Results are expressed as mean + SD. * denotes p<0.05 and *** denotes p<0.001 in comparison to control group (by Student’s unpaired t test, n = 10 for each group).

