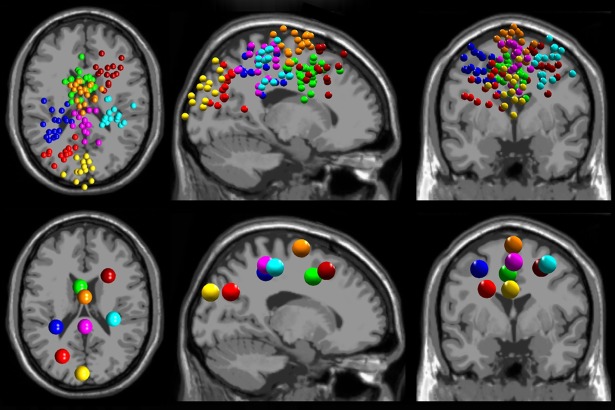
Fig 2. EEG source localization results.
EEG source localization results are shown for the 8 cortical clusters found across all subjects (n = 19). Dipole locations (top) and cluster centroids (bottom) are shown in transverse, sagittal, and coronal views (left to right). We found clusters in anterior parietal (purple), left sensorimotor (blue), right frontal (maroon), anterior cingulate (green), medial occipital (yellow), supplementary motor area (orange), left posterior parietal (red), and right sensorimotor (cyan).

