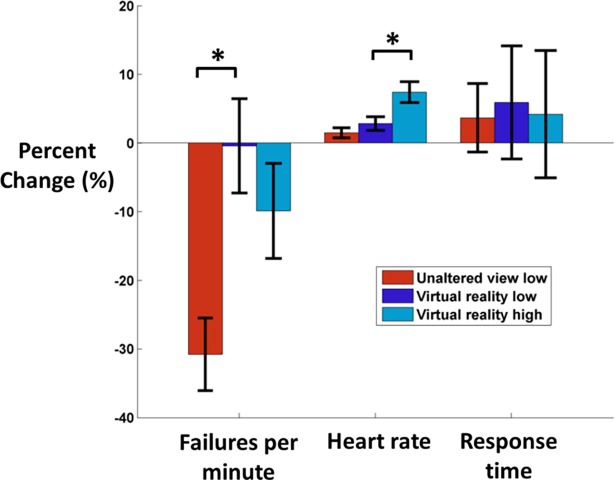
Fig 3. Percent change in failures per minute, heart rate, and response time.
To assess fatigue effects, we calculated the percent change (mean±SE) between the first and last 3 minutes of each condition (n = 19). Failures per minute, heart rate, and response time are shown for unaltered view low (red), virtual reality low (dark blue), and virtual reality high (light blue). Negative percent change indicates that the value in the final 3 minutes decreased compared to the first 3 minutes. Failures per minute percent change significantly decreased in unaltered view low compared to virtual reality low. Heart rate percent change significantly increased in virtual reality high compared to virtual reality low. No other comparisons were significant between 1) unaltered view low vs. virtual reality low and 2) virtual reality low vs. virtual reality high.

