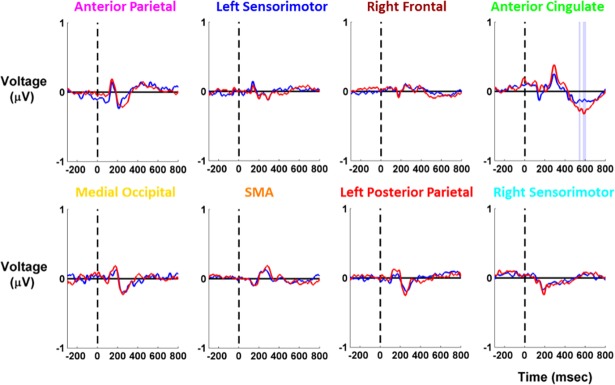
Fig 4. EEG event-related activity for cortical clusters.
EEG event-related activity is shown for each cortical cluster (n = 19), with unaltered view low in red and virtual reality low in blue. Tone presentation occurred at 0 ms, preceded by 300 ms of baseline activity. We analyzed 800 ms following the tone presentation. Shading reflects the condition with significantly higher amplitude (red for unaltered view low, blue for virtual reality low). We found significant differences in the anterior cingulate cluster only.

