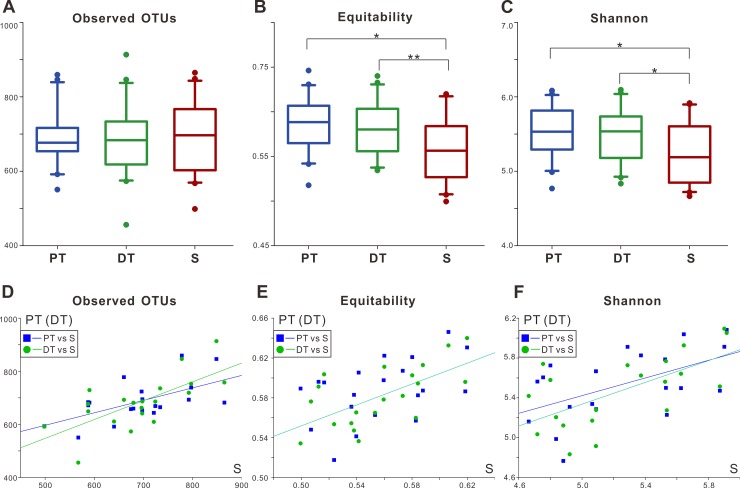
Fig 2. Alpha diversity of the microbial communities in permanent teeth (PT), deciduous teeth (DT), and saliva (S).
(A–C). Boxplots of three alpha diversity estimators for the three sampled groups; * P < 0.05, ** P < 0.01 by the post-hoc analysis for Friedman test in SPSS. (A). The observed OTUs index (richness estimator) was similar among the three groups. (B, C). The equitability (evenness estimator) and Shannon (diversity estimator) indices showed that PT and DT harbored significantly more even and diverse microbial communities than did S. (D–F). Alpha diversity relationships between the plaque groups (including PT and DT) and the S group. Correlation curves represent significant relationships (P > 0.05) between PT or DT and S. All indices of PT and DT were significantly correlated with that of S group (Spearman, P-values < 0.05), except the equitability index of PT (P = 0.081).

