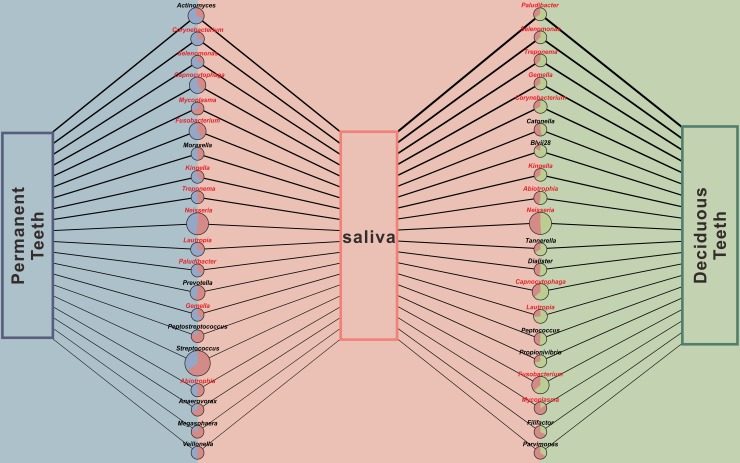
Fig 5. Supragingival plaque-correlated genera in saliva.
The Spearman correlation coefficient (SCC) values for the relative abundance between the plaque and saliva groups of each genus were respectively calculated. In the PT-vs.-S and DT-vs.-S analyses, genera with rs > 0.5 or rs < –0.5 at P < 0.05 are shown as circles arranged in decreasing order of SCC values. The circle size indicates the mean relative abundance in the corresponding plaque (PT or DT) and saliva (S) groups. Each dot is a pie chart consisting of two slices: blue and green slices indicate the relative abundances of the corresponding genus in permanent teeth (PT) and deciduous teeth (DT), respectively, and the pink slice indicates that of saliva (S). All selected genera had positive SCC values, indicated by the lines linking PT or DT with S. Line thickness corresponds to SCC. Red font indicates those genera occurring in both PT-S and DT-S analyses.

