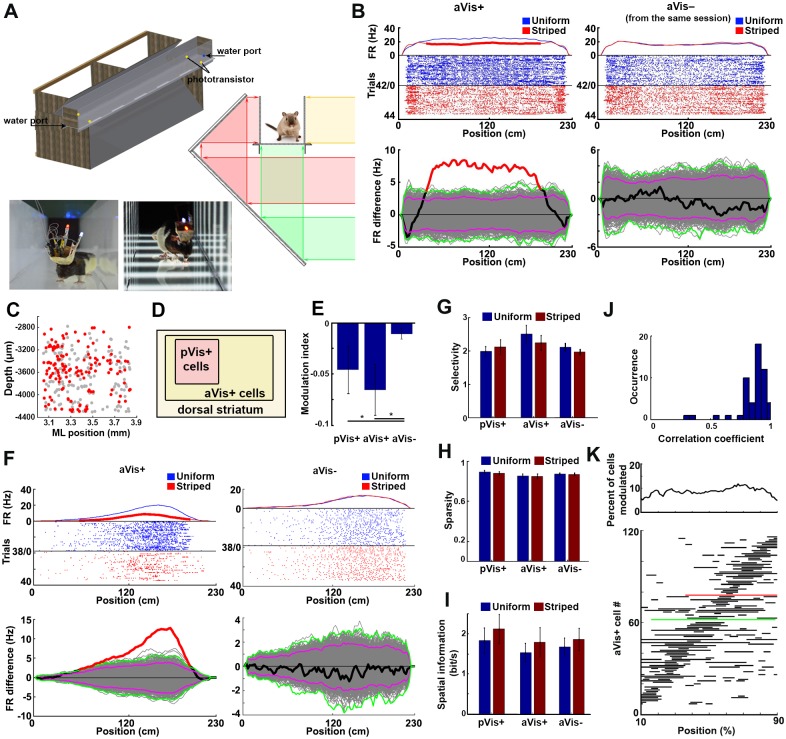
Fig 4. Self-motion-induced aVis stimulation of the striatal neurons.
(A) Schematics (left) and cross section (middle) of the linear maze with a dynamically updated visual environment. The bottom panels show photographs of rats running in the uniform and the striped environment. (B) Raster plots and place-resolved FRs of a representative pVis+/aVis+ (left, called as pVis+) and an aVis−/pVis− (right, called as aVis−) neuron simultaneously recorded during the same session. The blue dots and curve represent trials during uniform maze running; the red ones show the firing patterns in the striped maze. Note that the two conditions were randomly alternated from trial to trial. For display purposes, trials are reordered by the stripedness. Lower panels show the details of the statistical tests of space-resolved visual modulation. The thick black line shows the real FR difference, while the gray curves denote the label-shuffled surrogate differences. Purple and green lines depict the “local” and “global” significance thresholds [30], respectively. Spatial locations breaking the global significance limits are marked with a thick red line. (C) Location of the aVis+ neurons (red dots) in the coronal plane. The gray dots denote the location of the nonresponsive aVis− neurons. aVis+ neurons were distributed more uniformly in the recorded area than the pVis+ cells. (D) Venn diagram of the CPu neurons showing the set relationship of the aVis+ and pVis+ neurons. Note that all recorded pVis+ neurons were also aVis+ at the same time. (E) Mean modulation indices of pVis+, aVis+, and aVis− neurons in the aVis environment. Note that pVis+ neurons decreased their FRs when the rat was running in the striped maze, similar to their behavior in the pVis experiment. (F) Two representative striatal neurons with place field—like properties recorded simultaneously in an aVis session. Note that the activity of the left neuron was rate modulated by the stripedness (an aVis+ neuron), while the right example neuron was showing an almost identical spatial response profile in both the uniform and the striped conditions (aVis− neuron). Bottom panels show the details of the space-resolved statistical tests as on panel B. (G, H, I) Spatial coding efficiency expressed as “spatial selectivity” (G), “sparsity” (H), and “spatial information” (I) of the recorded neurons in uniform (blue bars) and striped conditions (red bars). (J) Distribution of the correlation coefficients of the spatially binned FRs of neurons with place field—like activity during running in the uniform and the striped environments. The place fields were stable across both the uniform and the striped conditions, as expressed by the high spatial correlation values of the neurons with place field—like activity. See also S5 Fig. (K) Distribution of the spatial segments at which the FRs of the aVis+ neurons were significantly rate modulated by the perceived visual motion (bottom). Green and red lines represent the example aVis+ neurons shown on panels “B” and “F”, respectively. Note that the significantly modulated segments uniformly tiled the whole extent of the maze (top plot). aVis, active visual; FR, firing rate; ML, mediolateral; pVis, passive visual.

