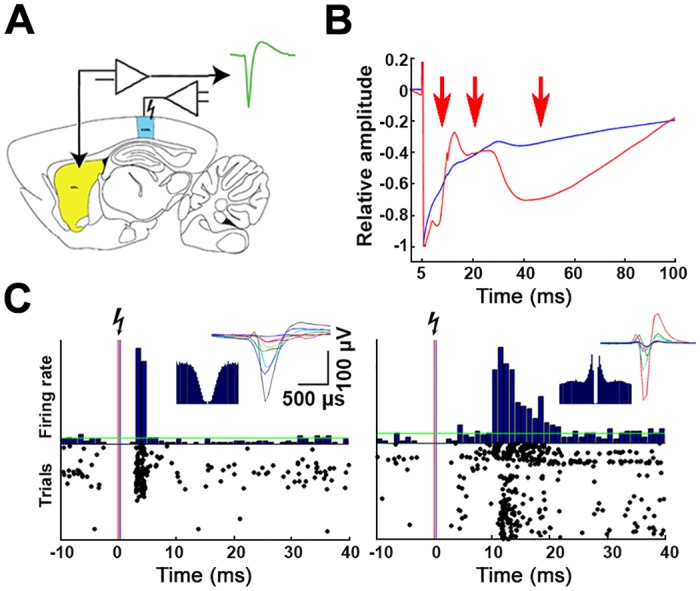
Fig 6. Entrainment of the CPu activity by electrical stimulation of the V2.

(A) Schematics of the electrical stimulation. The sites of the cortical stimulation and the striatal recordings are respectively marked by blue and yellow colors. (B) Representative striatal (red) and a control cortical (blue) mean LFP traces as a response to V2 electrical stimulation. Note the 3 remarkable evoked deflections in the striatal LFP (red arrows), which represent the aggregate population activity of the mono-, di-, and polysynaptically activated CPu neurons. (C) Representative peristimulus time histograms and raster plots of a monosynaptically (left panel) and a polysynaptically (right panel) entrained CPu neuron during electrical stimulation of the V2. The insets show the waveforms and autocorrelograms of each example neuron. CPu, caudate putamen; LFP, local field potential; V2, secondary visual cortex.
