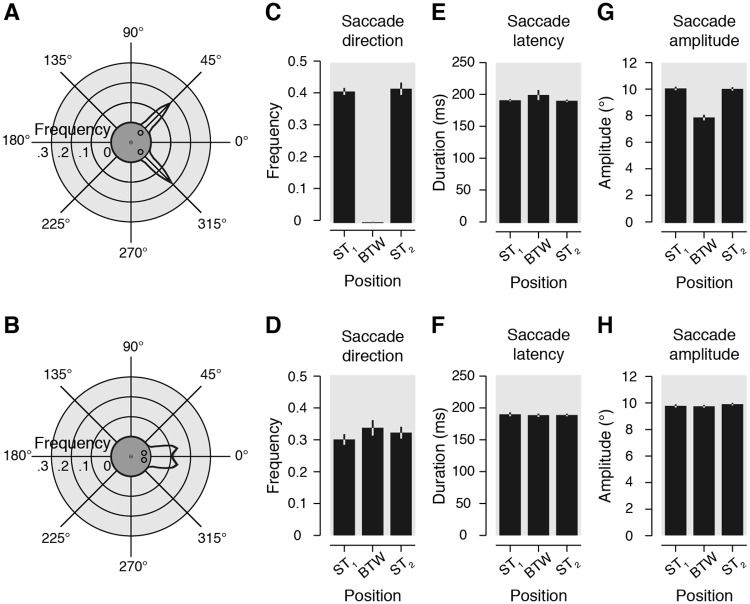
Fig 2. Saccade metrics.
(A, B) Circular plots show the averaged frequency distribution of the saccade landing direction binned in evenly distributed angular sectors of 5°, in the 90° (panel A) and 30° (panel B) conditions. Stimulus configuration is rotated as to align the 2 saccade targets symmetrically around the geometrical angle zero (see central insets). (C, D) Bar graphs illustrate averaged frequency of trials as a function of the saccade landing direction binned in 24 evenly distributed angular sectors of 15°. Data are shown for the 3 positions of interest (ST1, BTW, and ST2) in the 90° (panel C) and 30° (panel D) conditions. (E–H) Averaged saccade latency (E, F) and amplitude (G, H) observed for the same 3 positions of interest in the 90° (panel E and G) and 30° conditions (panel F and H). All data are shown irrespective of the duration (continuously or transiently) of the saccade targets. Light gray areas and error bars represent SEM. Polar plot black lines and corresponding light gray areas show linear interpolation between data points. BTW, position in between the saccade targets; ST1, saccade target 1; ST2, saccade target 2.

