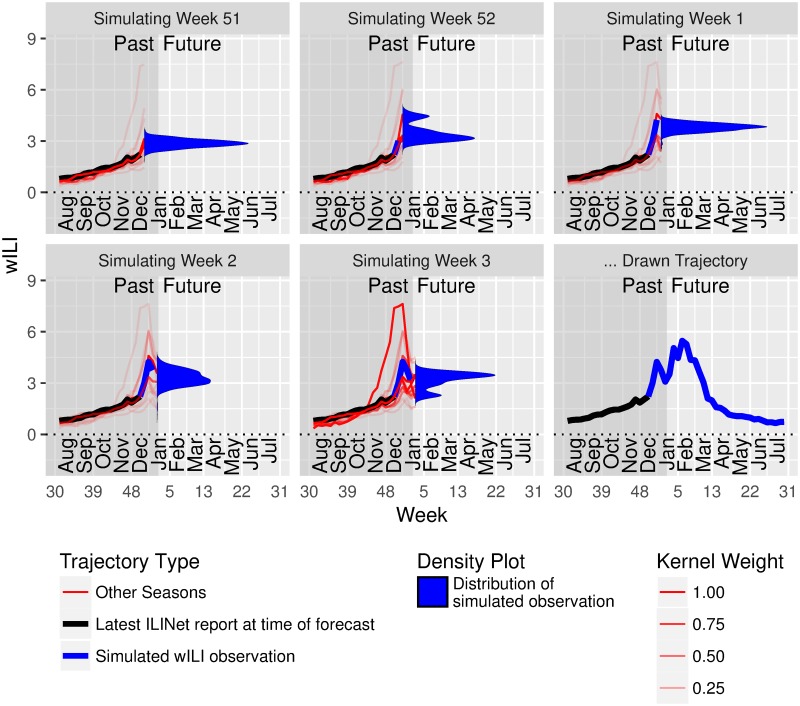
Fig 1. The delta density method conditions on real and simulated observations up to week u − 1 when building a probability distribution over the observation at week u.
This figure demonstrates the process for drawing a single trajectory from the Markovian delta density estimate, ignoring the data revision process. The latest ILINet report, , which incorporates observations through week 48, is shown in black. Kernel smoothing estimates for future values at times u from t + 1 to T are shown in blue, as are simulated observations drawn from these estimates. Past seasons’ trajectories are shown in red, with alpha values proportional to the weight they are assigned by the kernel Iu.

