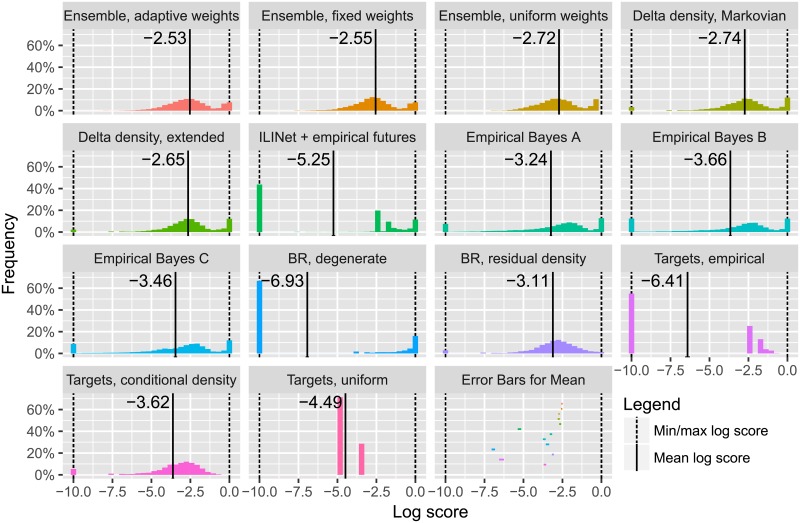
Fig 5. Delta and residual density methods cover more observed events and attain higher average log scores than alternatives operating on seasons as a unit; ensemble approaches can eliminate missed possibilities while retaining high confidence when justified.
This figure contains histograms of cross-validation log scores for a variety of forecasting methods, averaged across seasons 2010/2011 to 2015/2016, all locations, forecast weeks 40 to 20, and all forecasting targets. A solid black vertical line indicates the mean of the scores in each histogram, which we use as the primary figure of merit when comparing forecasting methods; a rough error bar for each of these mean scores is shown as a colored horizontal bar in the last panel, and as a black horizontal line at the bottom of the corresponding histogram if the error bar is wider than the thickness of the black vertical line.

