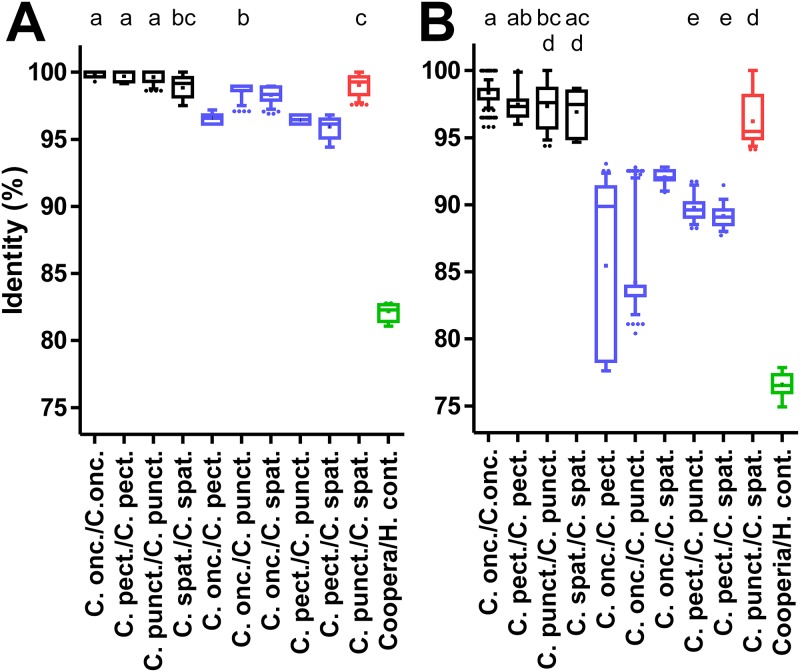
Fig 3. Pairwise sequence identities for intra- and inter-species comparisons for nuclear ITS-2 and isotype 1 β-tubulin loci.
Identities were calculated from multiple sequence alignments for the ITS-2 region (A) and a partial genomic isotype 1 β-tubulin gene containing two introns (B). Data are presented as box plots showing the median and 25 and 75% percentiles. Whiskers represent 5–95% quantiles and outliers are represented by dots while the cross indicates the mean. Intra-species comparisons are shown in black, inter-species comparisons within the genus Cooperia in blue, comparisons between C. punctata and C. spatulata in red. All comparisons between a Cooperia sequence and a representative H. contortus sequence are indicated in green. Accession numbers for all sequences that were included in the analysis are available from S2 Table. Datasets that do not share at least one of the index letters (a-c in panel A and a-e in panel B) are significantly different (p<0.05) from each other in a Kruskal-Wallis test followed by a Dunn’s post hoc test between all Cooperia groups.

