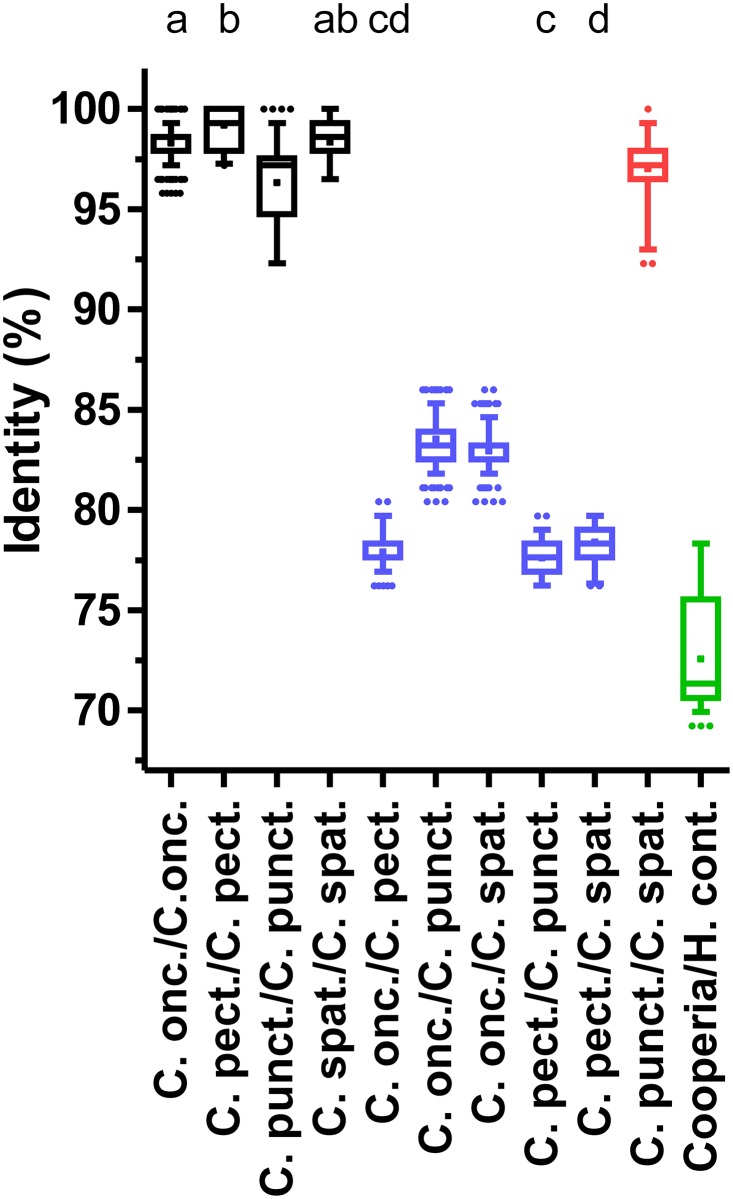
Fig 4. Pairwise sequence identities for intra- and inter-species comparisons at the 12S mitochondrial locus.
Identities were calculated from a multiple sequence alignment of the partial mitochondrial 12S rRNA sequence. Identities are shown as box plots with whiskers representing 5–95% quantiles. Dots indicate outliers and the cross marks the means of the datasets. Intra-species comparisons are colored in black, inter-species comparisons within the genus Cooperia in blue and comparisons between C. punctata and C. spatulata in red. Comparisons between any Cooperia sequence and a representative H. contortus sequence are indicated in green. All accession numbers for included sequences are provided in S2 Table. Datasets without at least one of the index letters (a-d) in common are significantly different (p<0.05) from each other as revealed by Kruskal-Wallis test followed by a Dunn’s post hoc test between all Cooperia groups.

