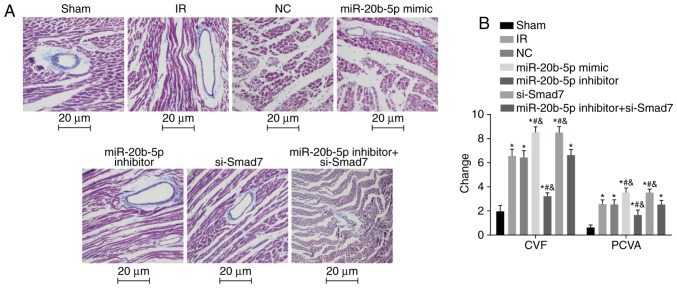
Figure 5.
Masson's staining of myocardial tissue from rats in each group. (A) Masson's staining of myocardial tissue from rats in each group (magnification, ×400). (B) Changes in CVF and PVCA in rats in each group are shown in a bar graph. *P<0.05, compared with the sham group; #P<0.05, compared with the IR group; &P<0.05, compared with the miR-20b-5p inhibitors + si-Smad7 group. CVF, myocardial collagen volume fraction; PVCA, perivascular collagen area; miR-20b-5p, microRNA-20b-5p; Smad7, small mothers against decapentaplegic homolog 7; si-, small interfering RNA; NC, negative control; IR, ischemia-reperfusion.

