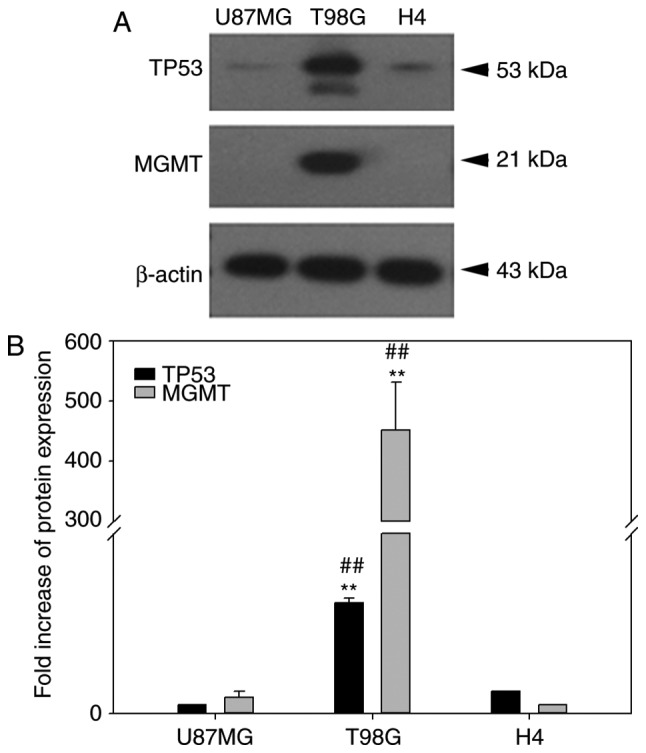
Figure 7.

p53 and MGMT expression status of U87MG, T98G and H4 cell lines. (A) Representative plots from western blot results for p53 and MGMT protein expression levels in the three glioma cell lines. (B) Quantitative plot of p53 and MGMT expression levels following normalization to β-actin expression. TP53, tumor protein p53; MGMT, O6-methylguanine DNA methyltransferase. T98 G cells demonstrated an increased TP53 and MGMT expression compared with the two other cell lines. **P<0.001 vs. the U87MG, ##P<0.01 vs. the H4 cells.
