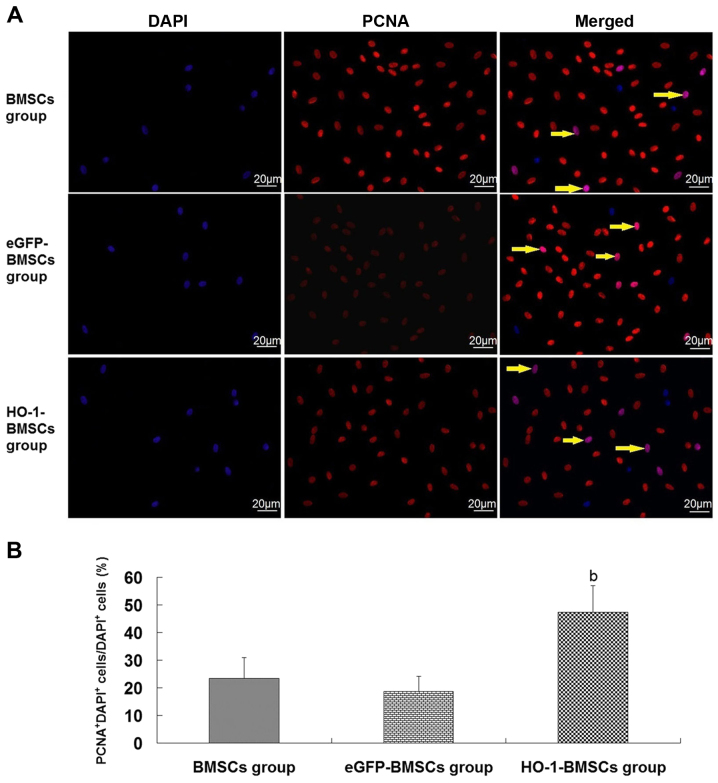
Figure 5.
PCNA+ BMSCs trapped in the kidneys of rats with ischemia/reperfusion-induced acute kidney injury. (A) Immunofluorescent staining images. Blue nuclei in the left panel indicate DAPI+ cells (BMSCs), red nuclei in the middle panel indicate PCNA+ cells, and purple nuclei (arrows) in the right panel indicate PCNA+DAPI+ cells (PCNA+ BMSCs). Scale bar, 20 µm. (B) Quantitative analysis. The ratio of PCNA+ BMSCs/BMSCs in the HO-1-BMSCs group is the highest. Results are presented as the mean ± standard deviation (n=10 rats). bP<0.05 vs. BMSCs group. PCNA, proliferating cell nuclear antigen; BMSCs, bone marrow-derived mesenchymal stem cells; HO-1, heme oxygenase-1; eGFP, enhanced green fluorescent protein.

