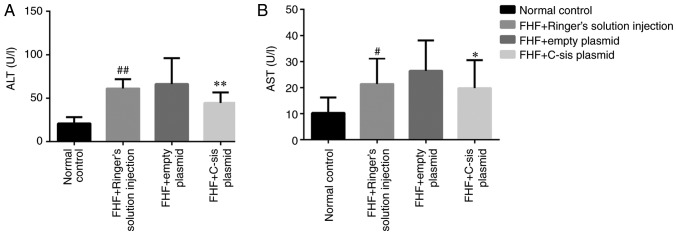
Figure 6.
Serum ALT and AST levels in each group. Serum (A) ALT and (B) AST levels in each group. The results are presented as the mean ± standard deviation. ##P<0.01 (ALT) and #P<0.05 (AST) vs. normal control group; **P<0.01 (ALT) and *P<0.05 (AST) vs. FHF+empty plasmid group. Normal control group (n=10), FHF+Ringer's solution injection group (n=9), FHF+empty plasmid group (n=9), and FHF+C-sis plasmid group (n=10). ALT, alanine transaminase; AST, aspartate transaminase; FHF, fulminant hepatic failure.

