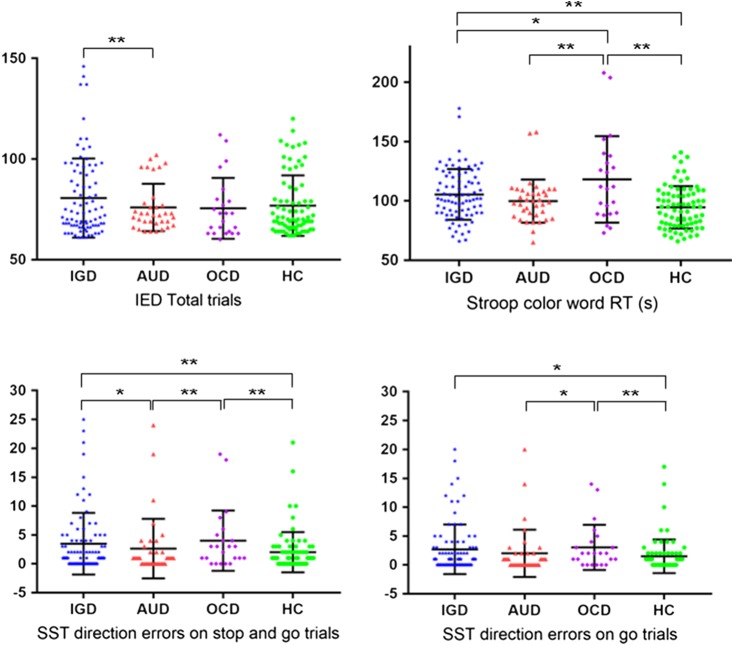
Figure 1.
Frequency distribution plots of significant group differences. IGD: Internet gaming disorder; AUD: alcohol use disorder; OCD: obsessive–compulsive disorder; HC: healthy controls; IED: intra–extra dimensional set shift; Stroop color-word RT: stroop color of color-word reading time; SST: the stop-signal test. *Significant difference in the post-hoc test with p < .05. **p < .01

