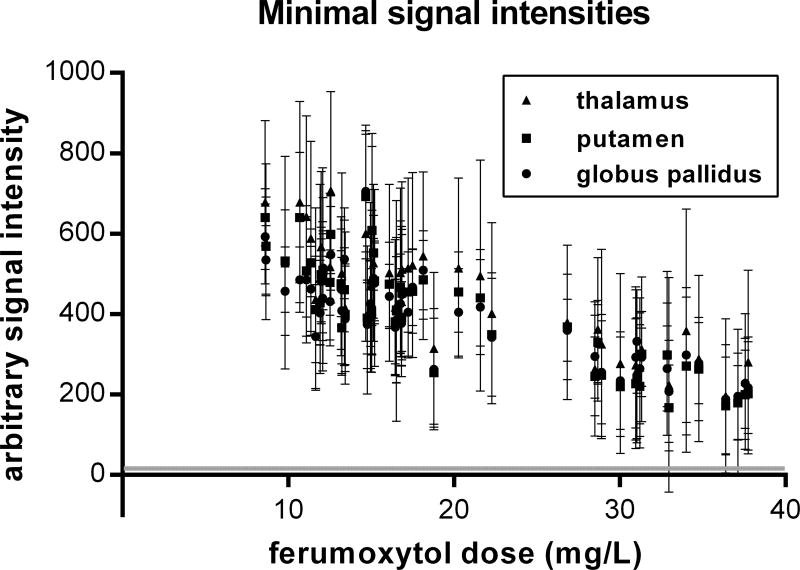
Figure 4.
Minimal signal intensities in normal appearing deep gray matter regions (N=162 total) during the first pass of the ferumoxytol bolus with the agent doses adjusted for total circulating blood volume. Error bars indicate the 95% CI of the means. The mean minimal signal intensities remained highly above noise level, and only 3 thalamic VOI means were associated with 95% CIs overlapped with the 95% CI of the noise (grey horizontal line).

