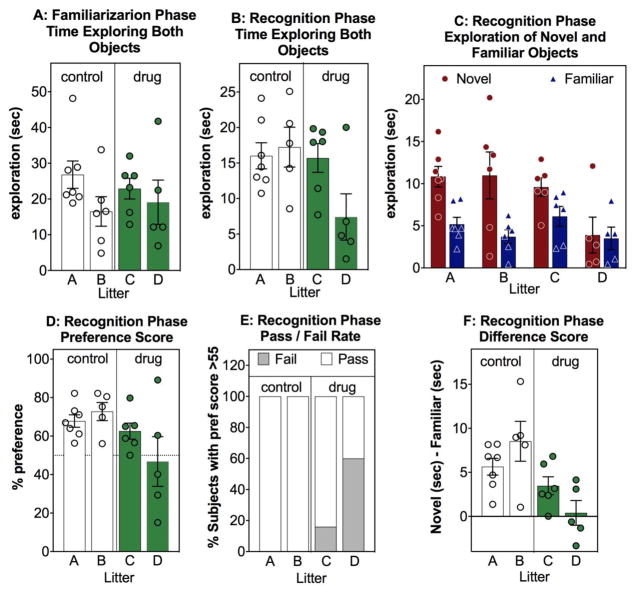
Figure 2.
Common methods for analyzing and illustrating novel object recognition data. (A) Total object exploration of both objects (in seconds) during the familiarization phase (training, Trial 1, sample phase) scored and illustrated separately for each of four litters (X axis- designated A, B, C and D) (B) Total object exploration of both objects (in seconds) during the novel object recognition phase (Test, Trial 2). (C) The absolute exploration of the new (novel) object (red, circle) and the old (familiar) object (blue, triangle), in seconds, during the novel object recognition test phase. (D) Preference score = [(exploration novel object in sec)/(exploration novel + exploration familiar)] X 100 during the novel object recognition test phase. A 50% preference score = the same exploration both the novel (new) and the familiar (old) object). (E) Pass/Fail rate indicates the % of subjects with and without a preference for the novel object, with a preference designated as > 55% preference score during the novel object recognition test phase. (F): Difference score = (exploration of novel object in sec)-(exploration of familiar object in sec) during the novel object recognition test phase. A difference score of 0 = the same exploration both the novel and the familiar object. Data shown are from 4 individual litters of C57Bl/6 mice wherein dams were treated during pregnancy with either normal drinking water or a drug in the drinking water. Offspring were tested at 5 mos. Litters A and B are control treated (open bars) and litters C and D are drug treated (green bars). Unpublished data by Gulinello, Einstein, IDDRC core.

